Troubleshooting
The bar is missing or will not open
Check capture first, then the response body, then the browser. This tells you where the toolbar stopped appearing.
Is the package running?
From the Laravel application root, check installation and the current environment:
composer show newdebugbar/newdebugbar
php artisan env
The default allowed environment is local. Check NEWDEBUGBAR_ENABLED and newdebugbar.environments. A value of false, or an environment outside that list, disables profiling, package routes, the toolbar, and MCP.
After changing configuration, clear the configuration cache and repeat the request:
php artisan config:clear
Was the response captured?
In your browser’s Network panel, select the application request and look for X-NewDebugBar-Profile. Check the request you just made, rather than an asset or the toolbar’s own update.
If there is no header, check the startup settings, package discovery, and whether this request is intentionally excluded. Package routes and toolbar-only Livewire updates do not create ordinary application profiles.
If the header is present, use its ID with MCP to check that the profile can be read. The header and successful storage are separate checks.
Should this response contain a toolbar?
The toolbar is injected into a supported HTML response with a closing </body> tag. JSON, redirects, downloads, attachment responses, and streamed responses can be captured without receiving toolbar HTML.
| Response | Expected result |
|---|---|
| Normal HTML document | A profile header and an injected toolbar |
| JSON or an API response | A profile header; inspect the saved profile through MCP |
| Redirect, download, or stream | No toolbar inserted into the response body |
| HTML fragment without a closing body tag | No automatic toolbar injection |
If the request was captured but no toolbar was expected, continue with Requests. You do not need to add HTML to an API response.
Is the markup present but the interface broken?
Search the response HTML for id="newdebugbar". When it is present, check the browser Console and Network panels for the first error, missing asset, or failed Livewire update.
- A 404 points to the requested asset or update URL. Compare the URL’s host, scheme, and any application path prefix.
- A blocked-script message points to the named browser policy or Content Security Policy directive. Follow that exact message; do not disable policies broadly.
- A multiple-Alpine error means there may be two Alpine runtimes on the page. Livewire bundles Alpine; follow the matching Livewire troubleshooting steps.
- A repeated 419 after a session change needs the failed update URL, response, and session/CSRF context. Reload once, reproduce, and inspect whether the failed request belongs to the host app or toolbar.
Check the result
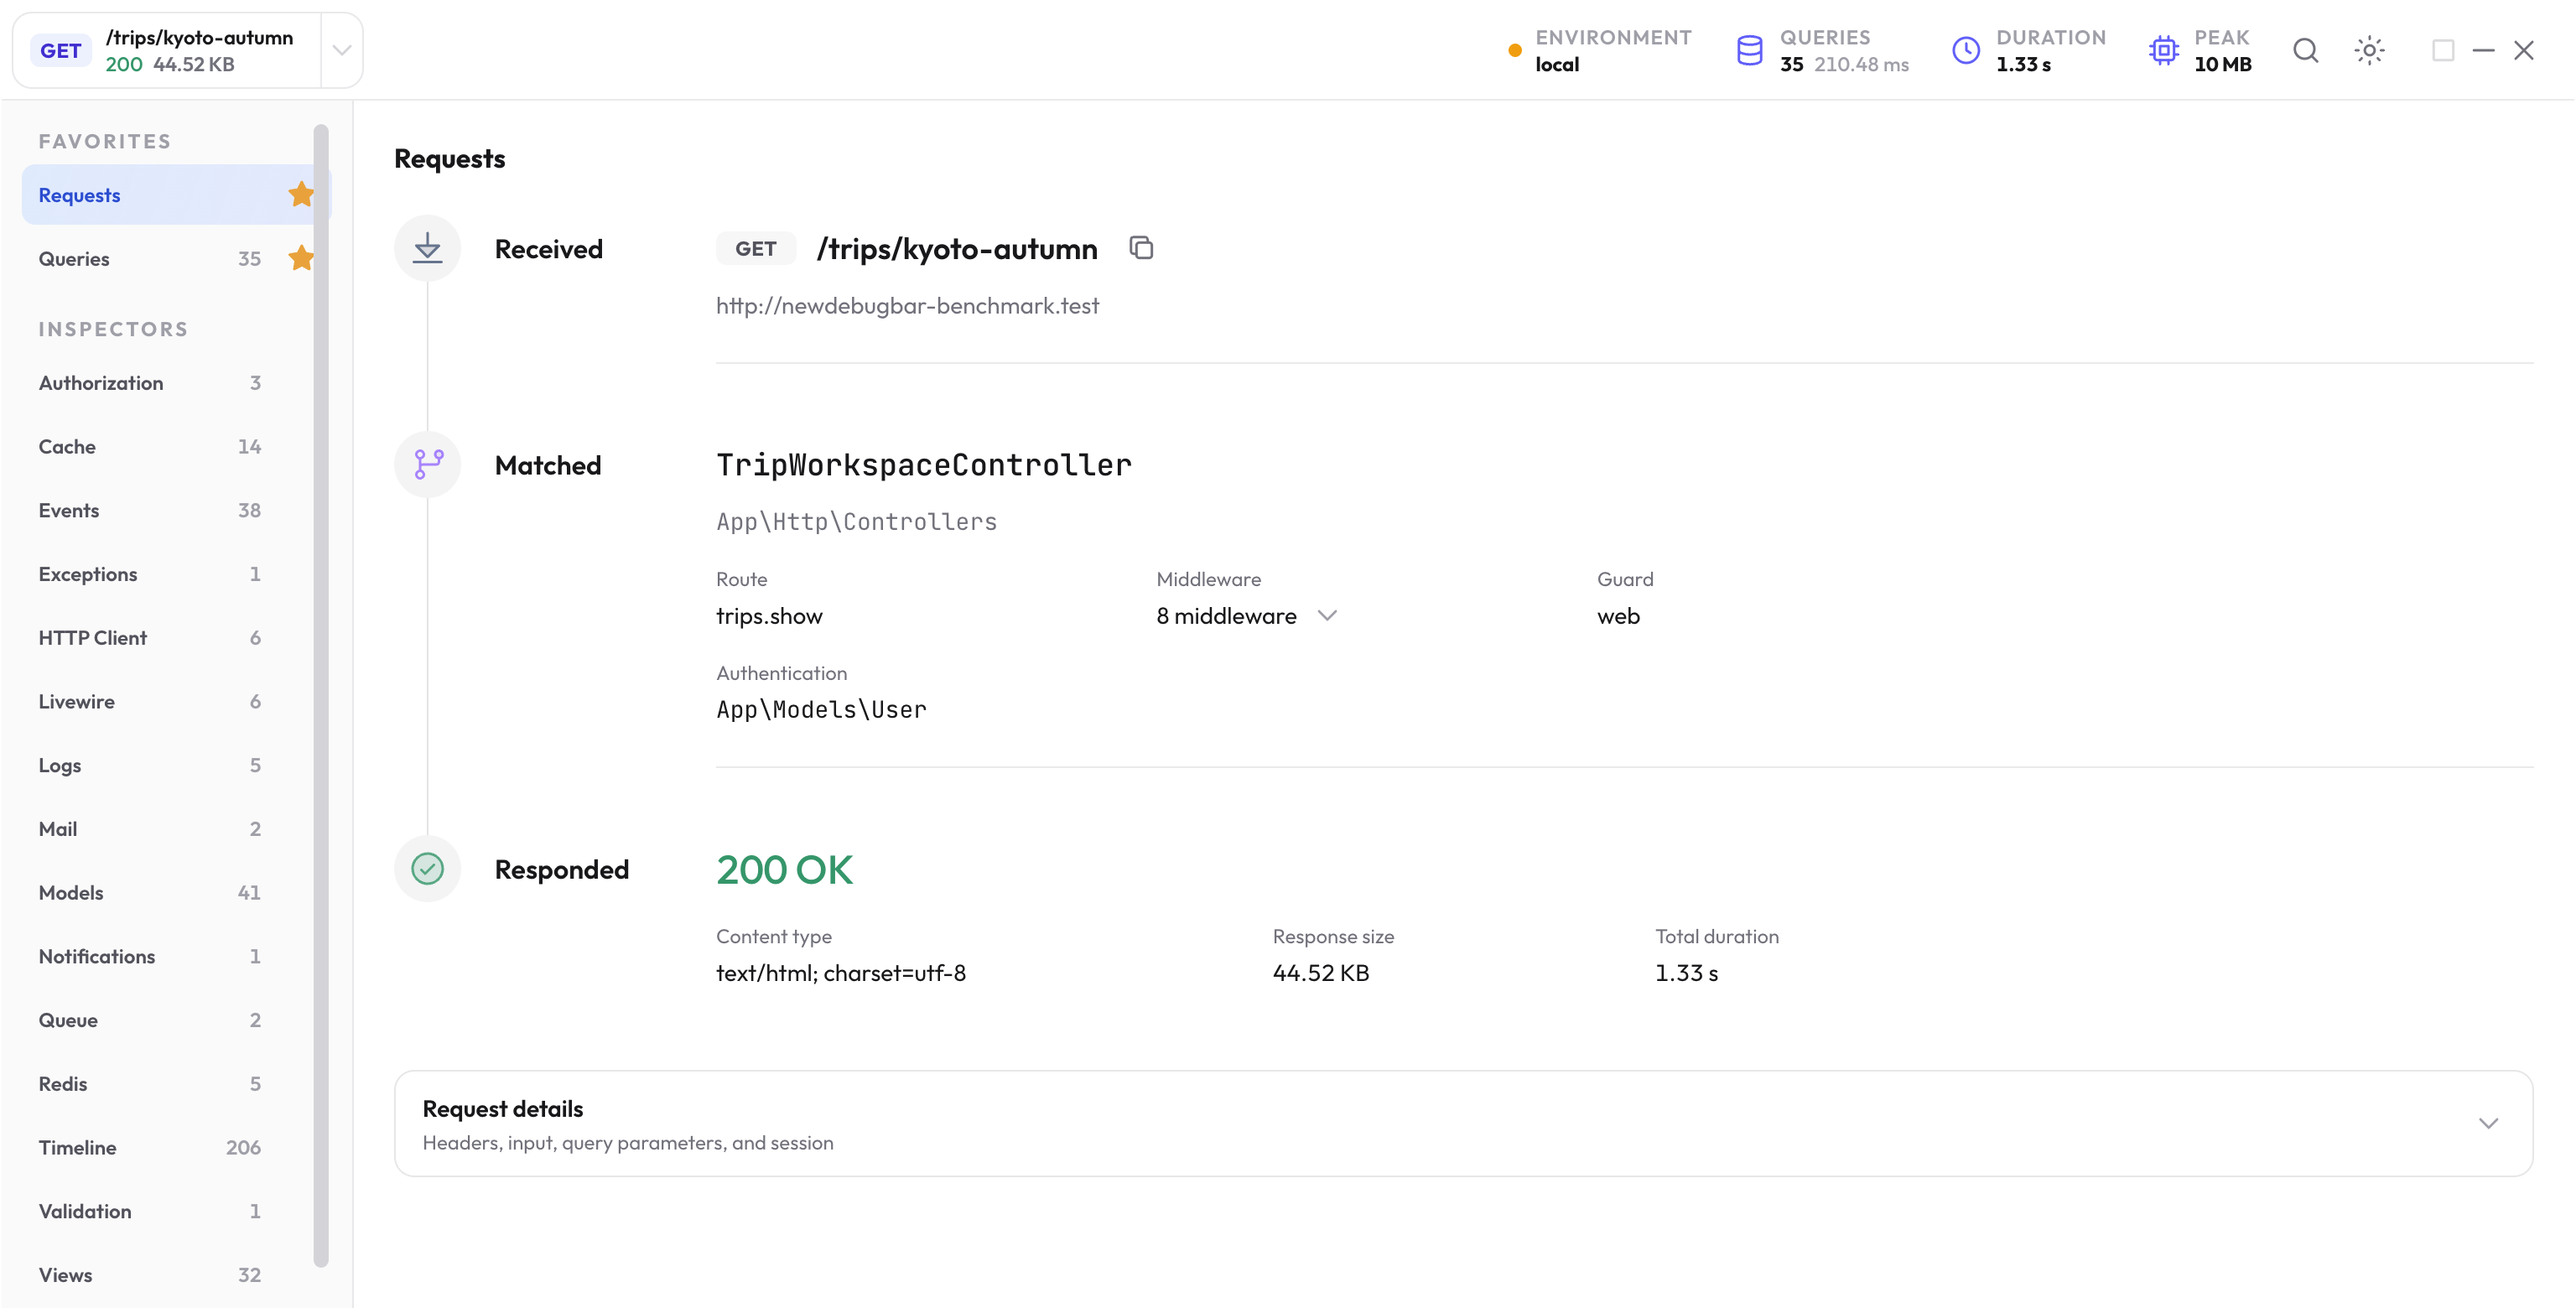
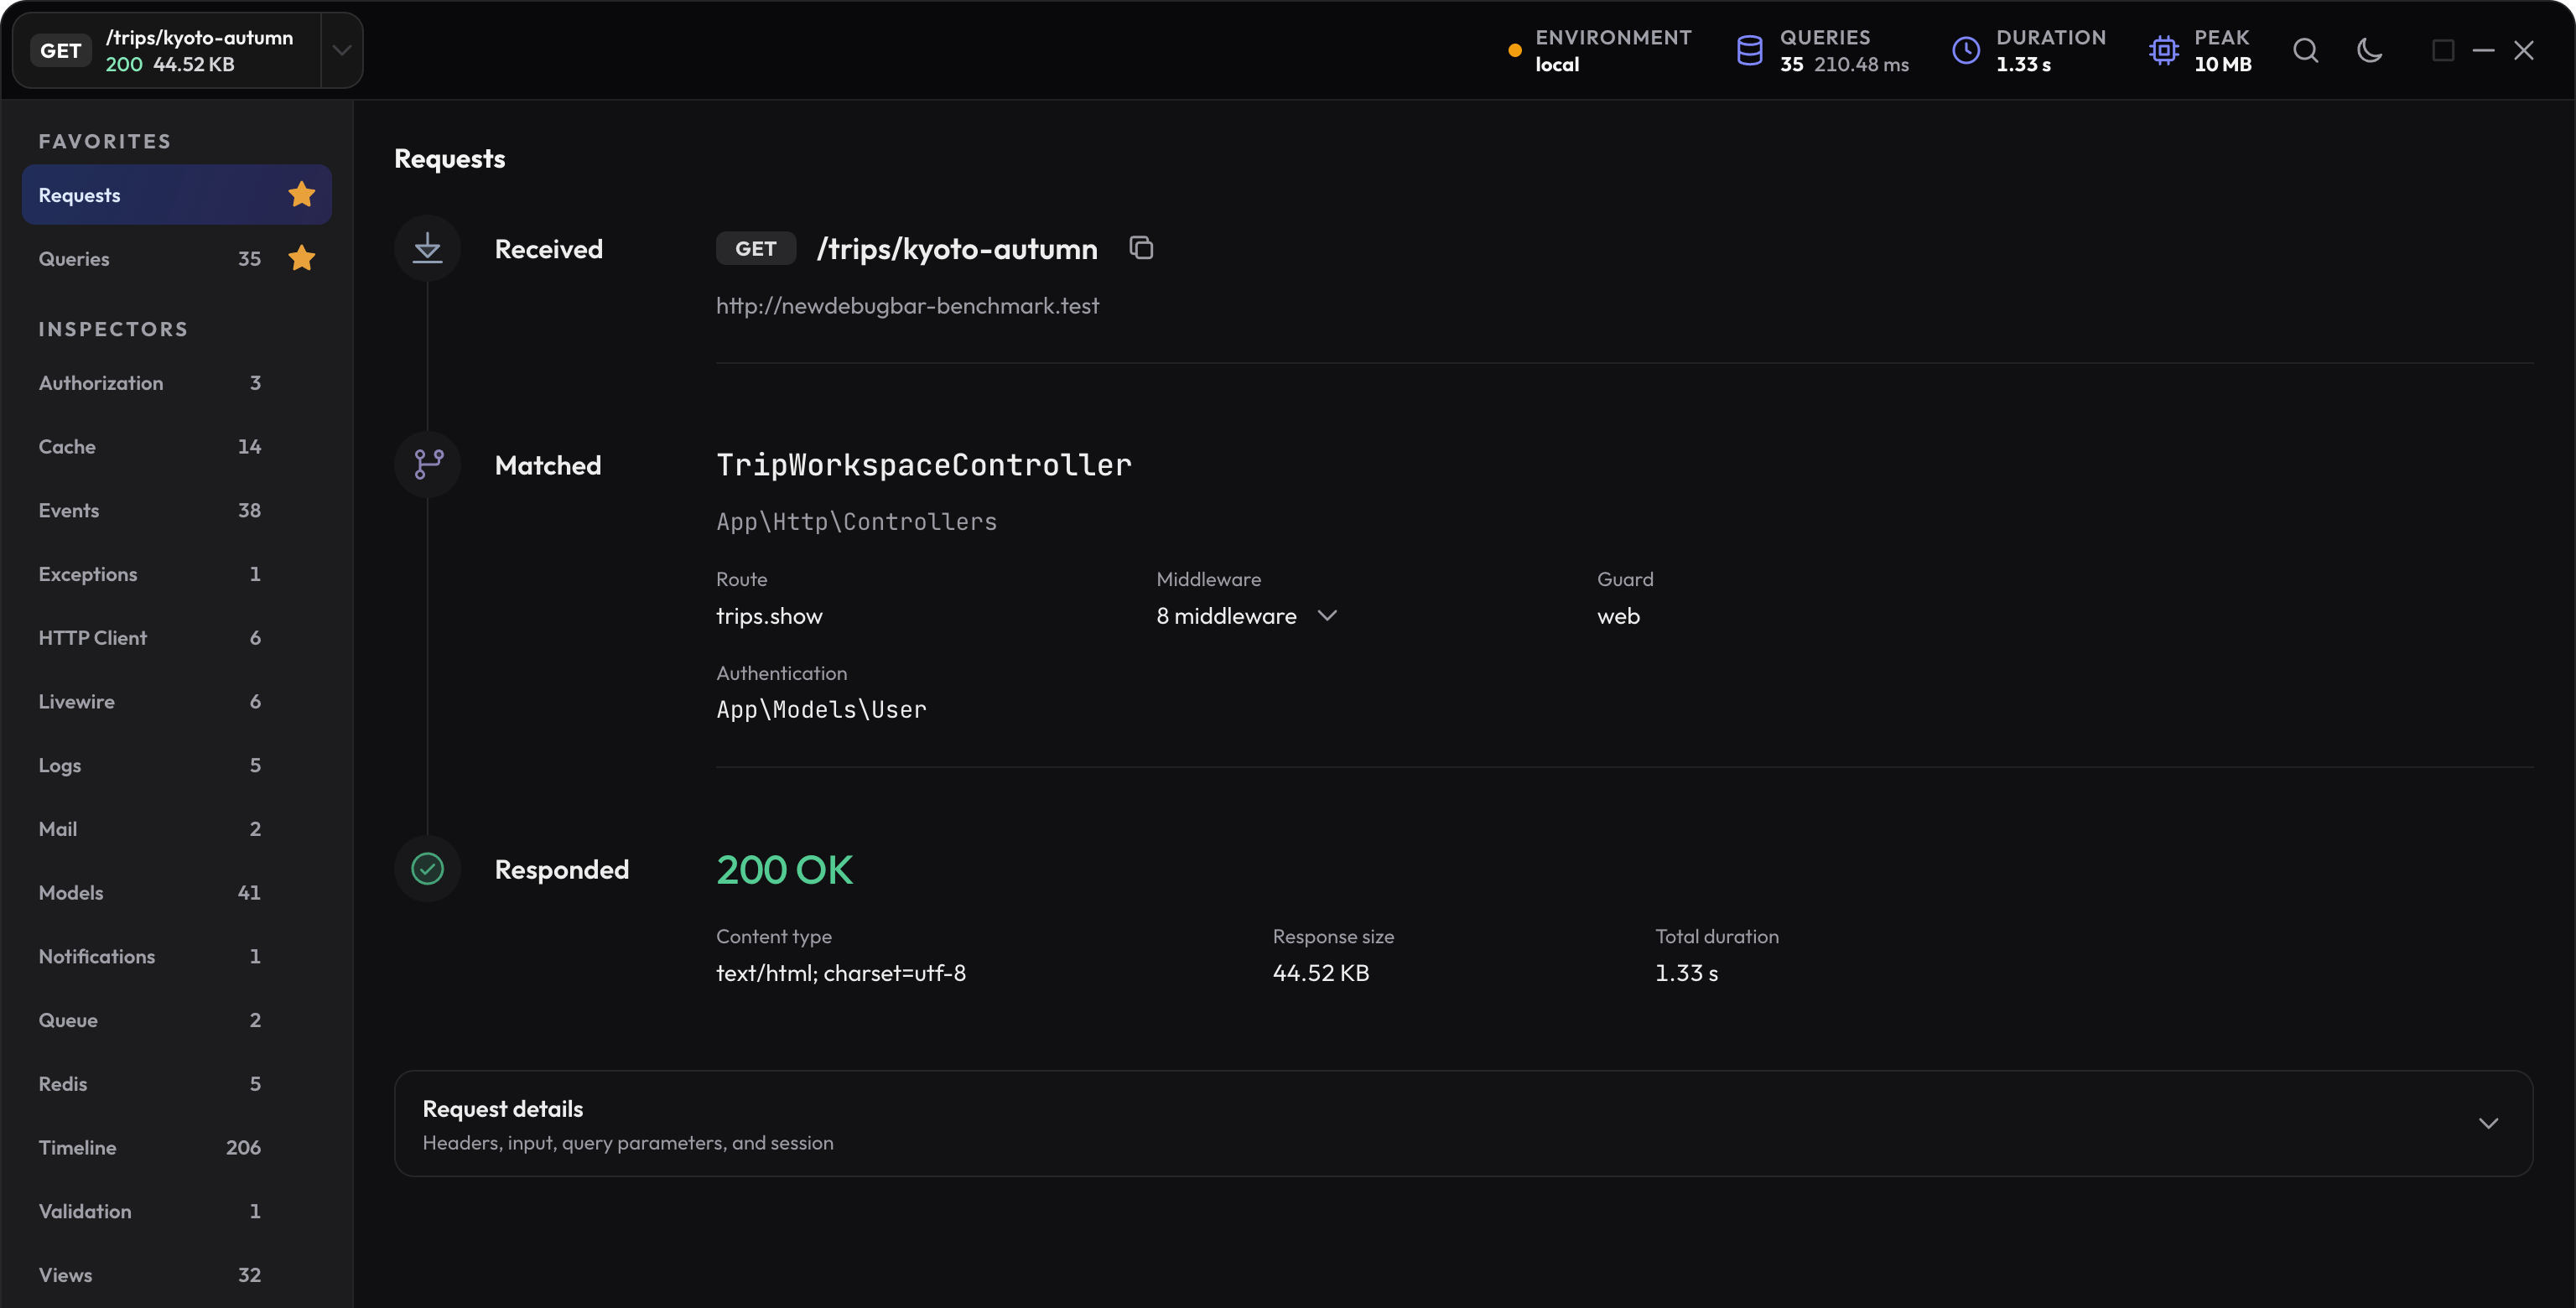
Reload the same HTML page. Confirm its profile header, open Requests, then open Queries. Both should finish loading, and the Console should have no related startup error. If the bar still fails, attach the exact failing request and error to a focused report.
Next step
Find the exact captured request
Follow the profile ID when the bar is working but the expected evidence is missing.
Read the guide