Reference
Choose the inspector that answers your next question
Each inspector keeps one kind of evidence focused. Start with the request overview or a finding, then open the smallest inspector that can explain the symptom.
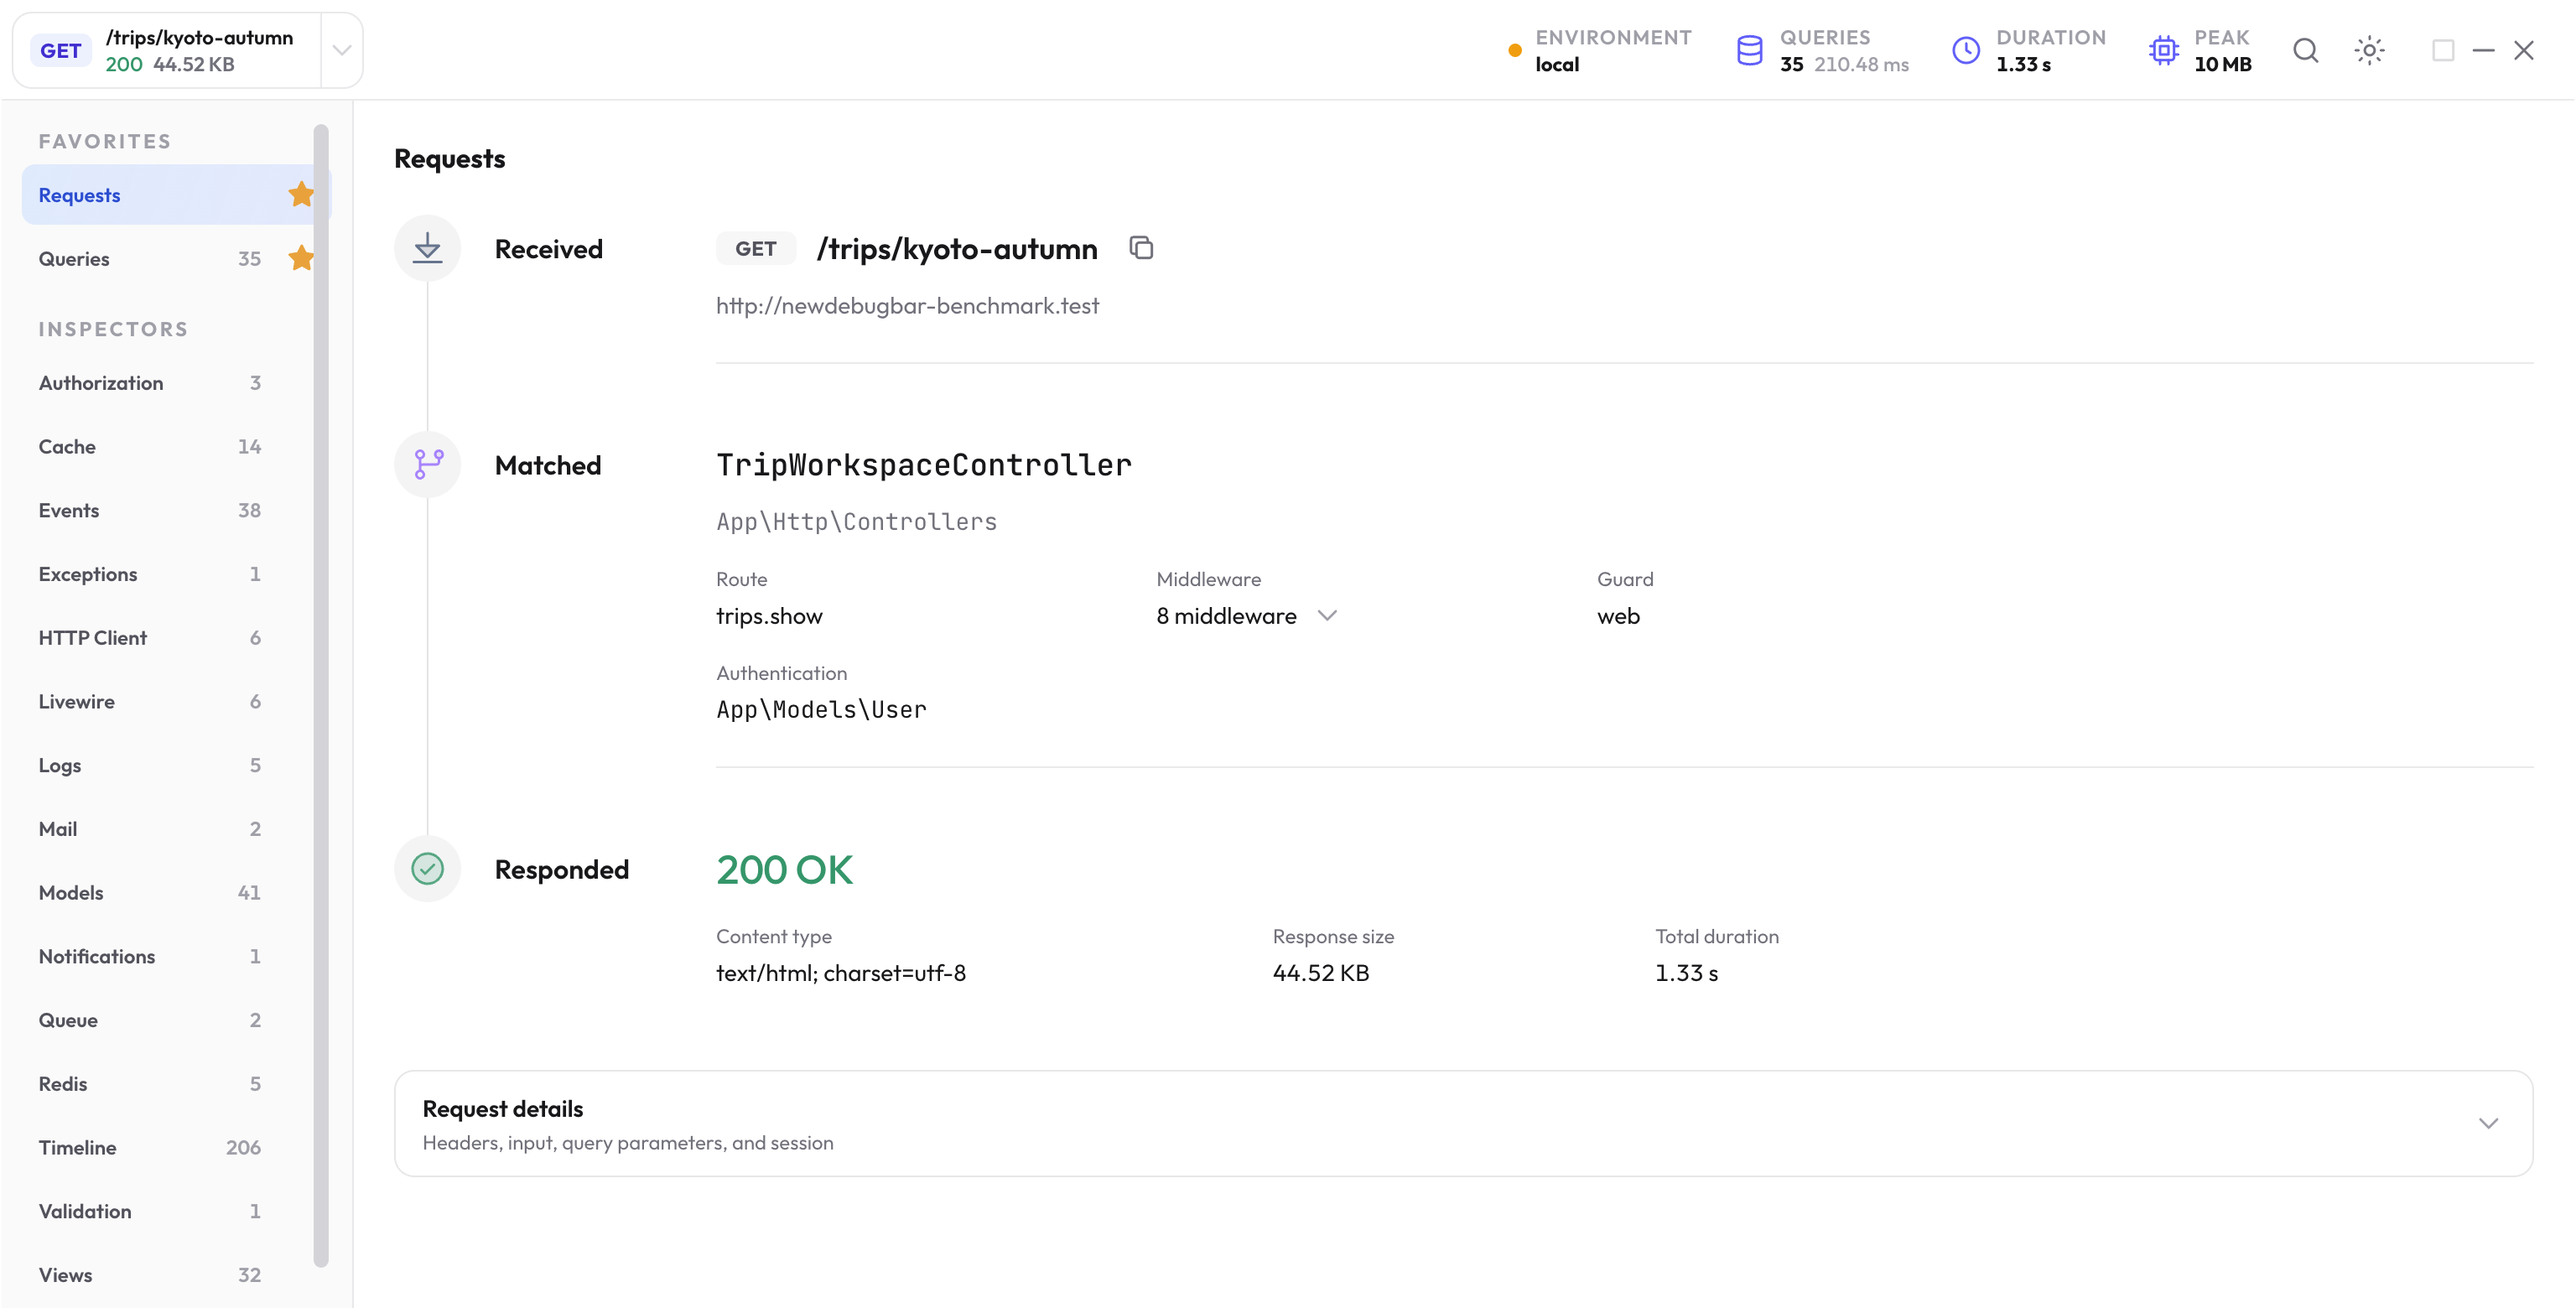
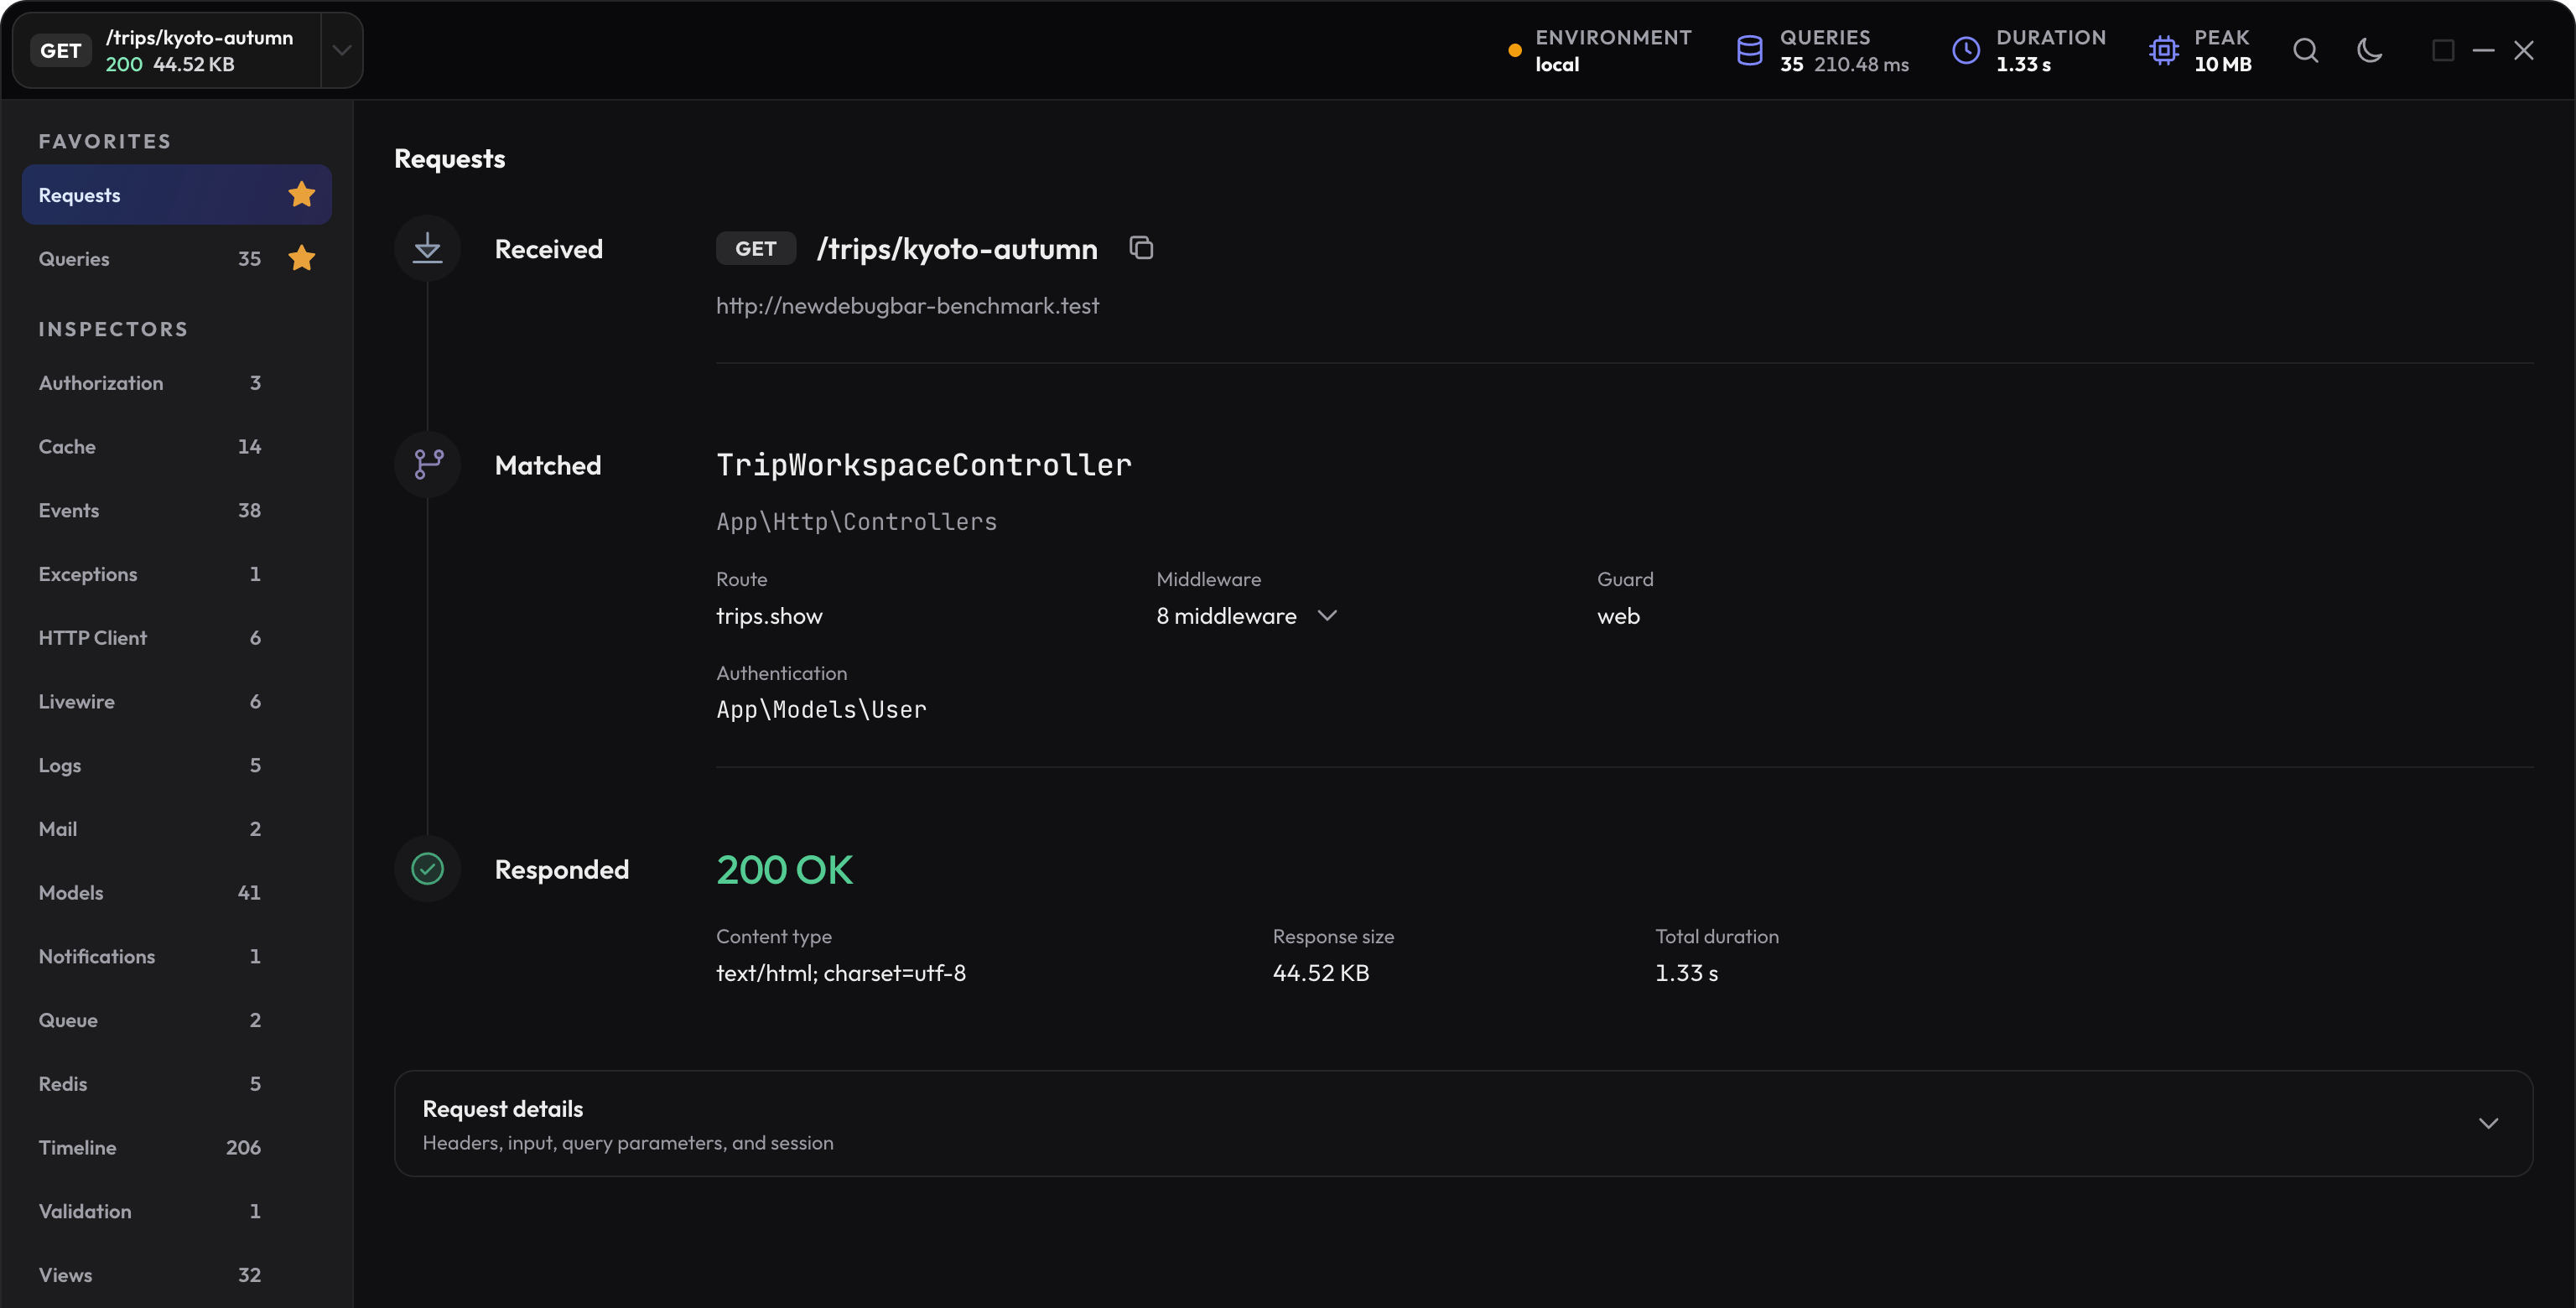
Move from symptom to source
-
Confirm the request profile
Match its method, path, status, type, and time before interpreting the inspector data. -
Use the overview or a finding
Let the visible symptom choose the first inspector instead of opening every tab. -
Follow application evidence
Open source locations, call stacks, related records, and ordered activity until you reach code that controls the behavior. -
Repeat the request
Verify the change on the same path and check that related behavior still works.
All inspectors
Requests
Select the request profile and review method, path, route, status, user, context, duration, and related activity.
Timeline
Follow important captured work in execution order across queries, HTTP calls, rendering, events, models, and other inspectors.
Queries
Inspect SQL, bindings, duration, connection, repeated patterns, likely N+1 leads, call sites, and supported EXPLAIN plans.
Models
Review Eloquent retrievals and writes, model identifiers, changed attributes, repeated records, sources, timings, and related queries.
Views
See rendered Blade templates, source files, bounded data, render order, repeated partials, and missing or unexpected values.
Livewire
Inspect Livewire 4 component instances, parentage, properties, source, views, lifecycle activity, effects, and failures.
Exceptions
Inspect reported exceptions, retained causes, application and vendor frames, source context, and the code path that failed.
Logs
Review log levels, messages, bounded context, channel information, and the application source that wrote each entry.
HTTP Client
Review outbound Laravel HTTP requests and responses, method, URL, status, timing, failure details, and source.
Queue
See dispatched jobs, connection and queue, delay and dispatch facts, payload context, source, and related worker activity when available.
Inspect created mail, recipients, subject, headers, HTML and text previews, attachments, and application source within configured limits.
Notifications
Inspect notification recipients, channels, payloads, delivery results or failures, timing, and source code.
Cache
Review Laravel cache reads, writes, deletes, stores, keys or hashes, hits and misses, timing, tags, and source.
Redis
Inspect direct Redis commands, connections, recognized keys or hashes, timing, failure state, and application call sites.
Events
See dispatched Laravel events, listener handling evidence, payload context, timing, and where dispatch happened.
Authorization
Review Gate and policy decisions, ability, result, user and arguments, source, and the policy or callback involved.
Validation
Review failed fields, messages, rules, submitted context, source, and component information for handled validation failures.
An empty inspector can be correct
A request that sent no mail should have no mail records. A page that made no direct Redis commands may still use Laravel’s cache abstraction and populate Cache instead. The absence of rows means The New Debug Bar retained no matching activity for that selected profile.
Agents can reach the same retained evidence
The local MCP server exposes every inspector’s retained evidence through bounded requests. Focused tools summarize common work, while get-debug-profile-data follows returned JSON Pointer paths into deeper evidence.
Capture-time masking, hashing, truncation, and retention apply equally to the browser inspector and MCP. The agent cannot read a value that the stored profile does not retain.
Open a focused guide
| Question | Guide |
|---|---|
| Which request or response am I looking at? | Requests |
| Why does SQL repeat or take too long? | Queries |
| Where did the request spend its time? | Performance |
| Which records were retrieved or changed? | Eloquent |
| Which template received the wrong data? | Blade views |
| Which component action caused this work? | Livewire |
| What failed, and what was logged nearby? | Errors and logs |
| Which remote call failed or waited? | HTTP client |
| What happened after dispatch? | Queues |
| Which message or channel was involved? | Mail and notifications |
| Did the correct key and store return a hit? | Cache and Redis |
| Why did an event or listener run twice? | Events and listeners |
| Why did a policy or Gate deny this action? | Authorization |
| Which field or rule stopped submission? | Validation |
Work outside a browser page
Use Artisan commands for command profiles and Queues for individual worker attempts. The MCP reference explains bounded access to retained inspectors and deeper profile values.
Next step
Give an agent the same inspector data
Connect the local read-only MCP server and use exact profile IDs to keep agent analysis on the right request.
Open the MCP setup guide