Debugging workflows
Trace query cost back to Laravel code
Start with the request’s database shape, separate repeated work from slow work, and use bindings and application call sites to find the cause.
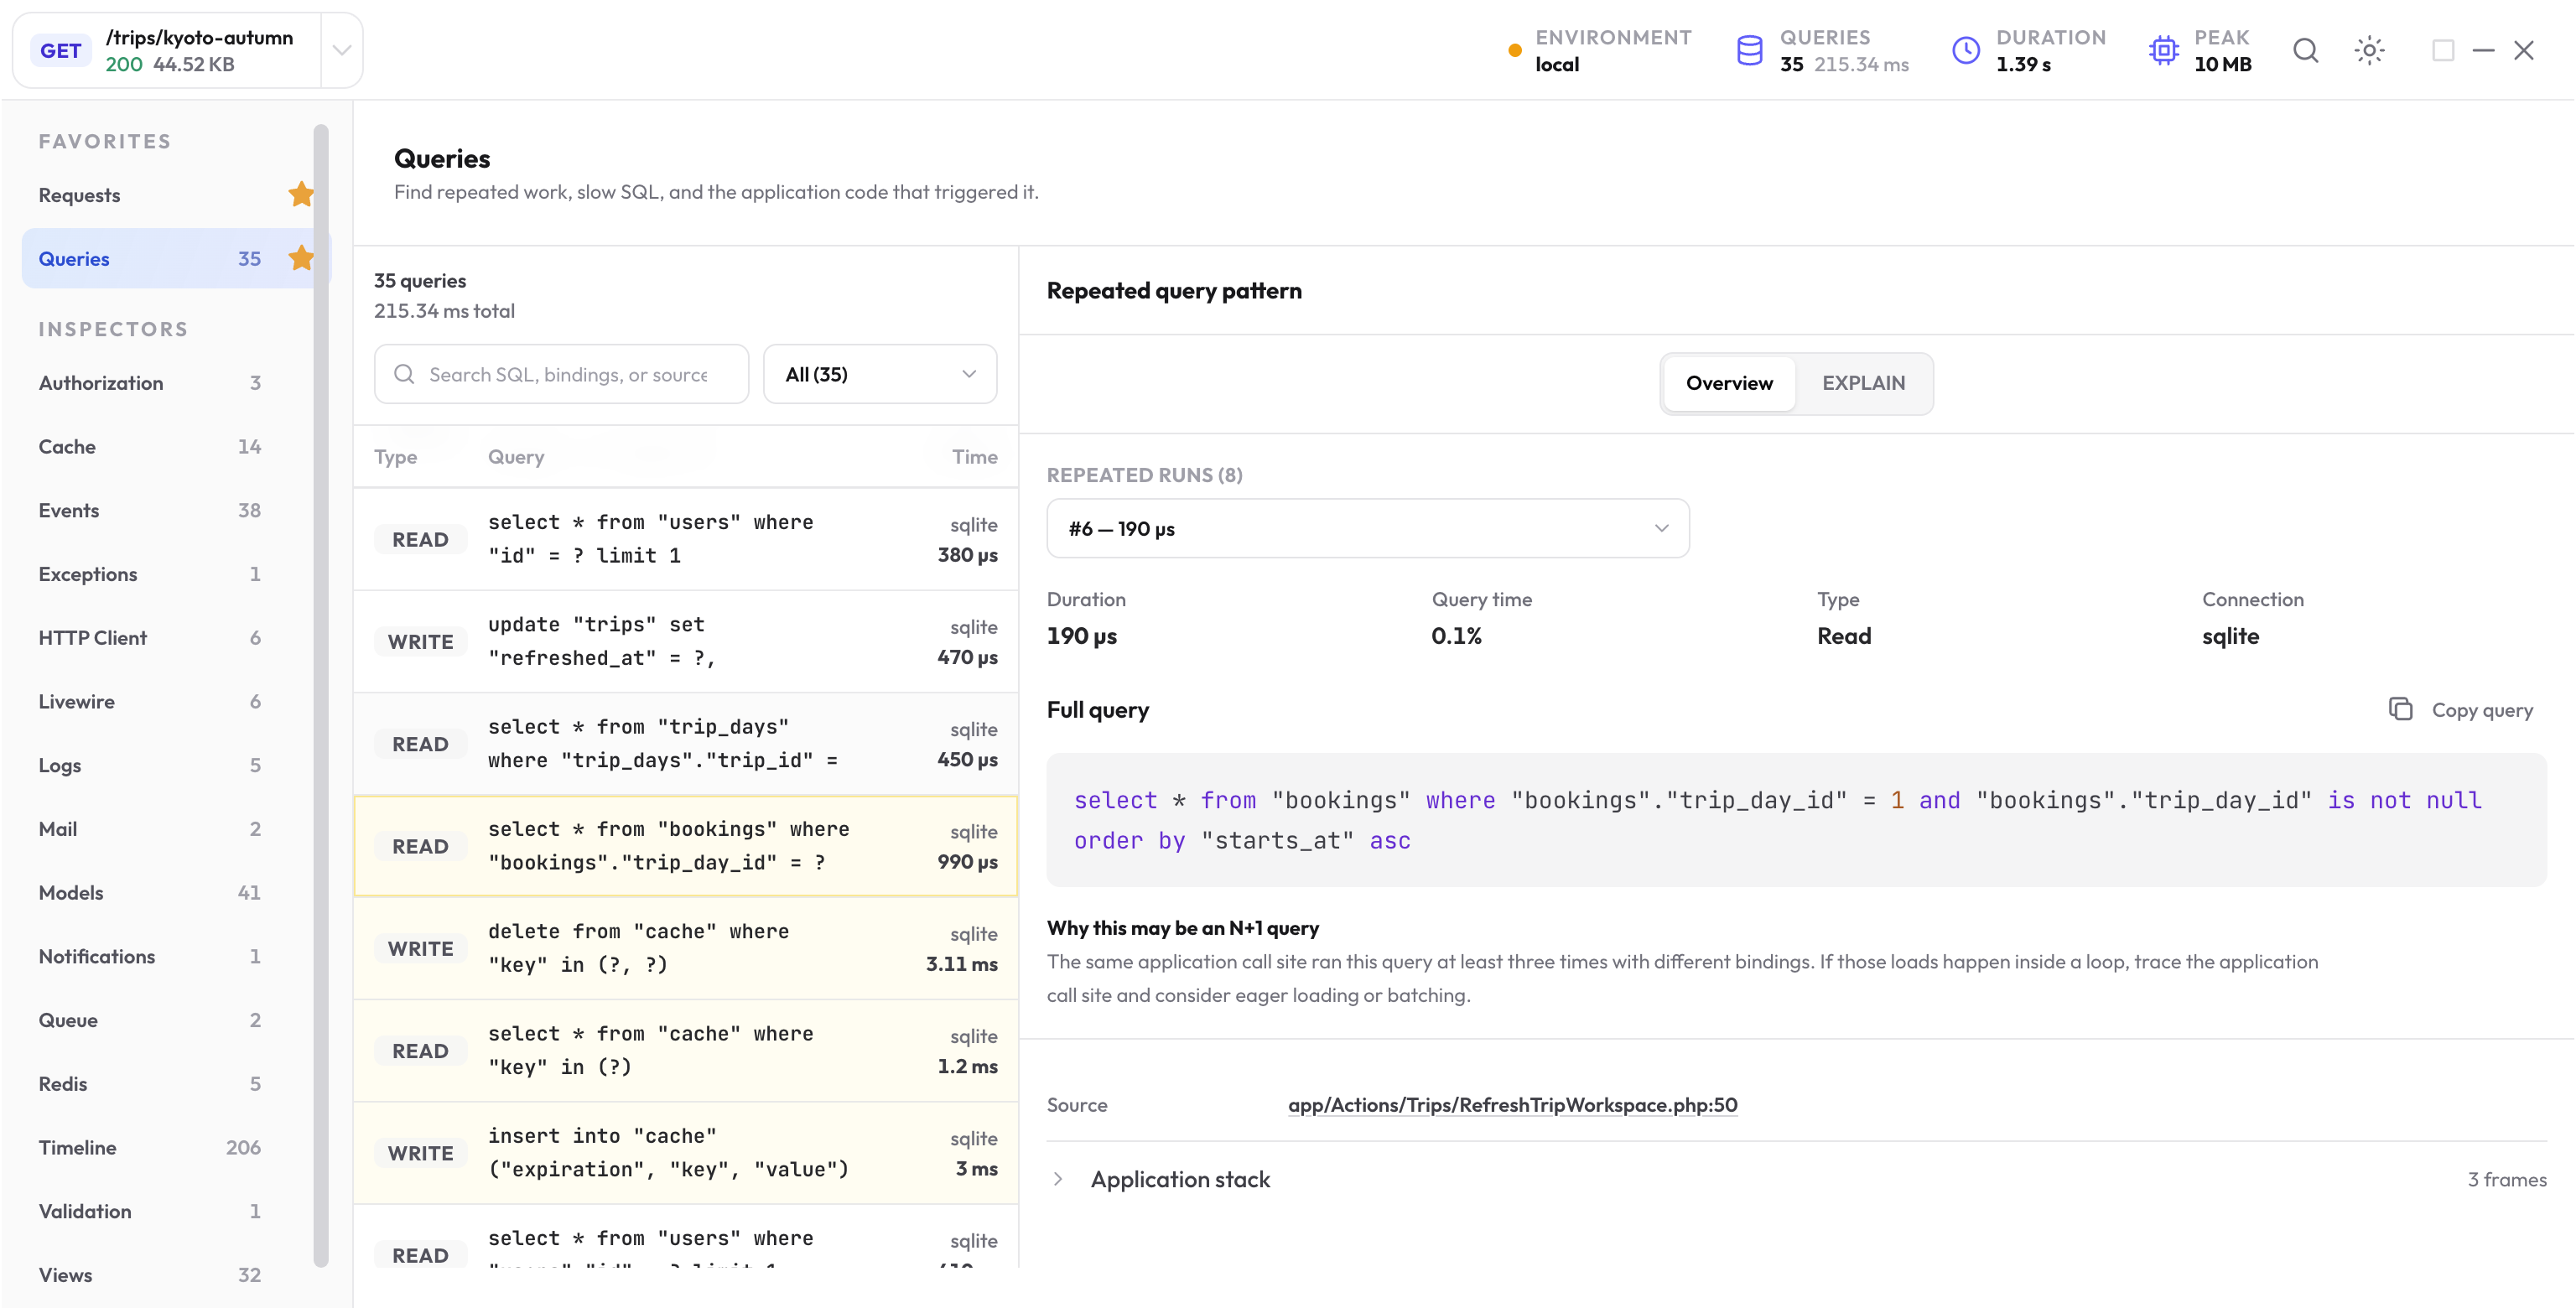
Triage the database work
-
Confirm the request
Match the method and path first. A background request can have a completely different query profile. -
Compare count and total time
Many fast queries suggest repeated application work. A few expensive queries suggest database planning, indexing, locking, or transferred data. -
Open findings and query groups
Use slow, repeated, and likely N+1 findings as shortcuts into the retained query evidence.
Investigate repeated queries and likely N+1 work
The New Debug Bar groups queries with the same normalized SQL shape. Different bindings can reveal a loop that loads one related record at a time.
- Check whether the repeated group grows with the number of models shown on the page.
- Compare bindings to see whether only an identifier changes between calls.
- Open the application call site and inspect the surrounding loop, resource, accessor, view, or relationship access.
- Look at the Models and Views inspectors for repeated retrieval or rendering that explains the query pattern.
Inspect a slow query
Open the query detail and keep its SQL, bindings, duration, connection, and source together. Copy the bound query when you need to reproduce the exact local case.
Use the EXPLAIN action to inspect the database plan for supported read queries. Look for a large scanned row count, an unexpected full scan, a costly sort, or an index that does not match the filters and ordering.
Find the application source
The source location and short application stack are usually more useful than the SQL text by itself. They show the controller, service, model, resource, or view path that caused the query.
If the first frame is shared infrastructure, move down the retained application frames until you reach the caller that controls the work. Then inspect nearby relationship access, conditional loads, pagination, aggregates, or repeated helper calls.
Verify the fix on the same path
- Repeat the same action with comparable records and a warm application.
- Confirm the repeated group or slow query disappeared for the intended reason.
- Check total query count, total query time, request duration, and returned behavior.
- Add a focused profile assertion when the query budget protects an important path.
Work through an eight-day N+1 example
The Kyoto benchmark has a Trip with eight days and a bookings relationship on each day. This loading step makes one day query and then one booking query per day:
$days = $trip->days()->get();

foreach ($days as $day) {
    $day->setRelation('bookings', $day->bookings()->get());
}
Open the repeated booking query group. It has eight runs with different day IDs and the same application source. Confirm that relationship loading is the work the page needs, then replace the loop:
$days = $trip->days()->with('bookings')->get();
| This loading step | Before | After |
|---|---|---|
| Queries for days | 1 | 1 |
| Queries for bookings | 8 | 1 |
| Total | 9 | 2 |
These are the counts for the isolated relationship-loading step. Other page queries remain. Compare the returned day IDs, booking IDs, and ordering before accepting the change.
If each day needs a different filter, inspect that rule before applying the same eager load. See Laravel’s eager-loading guide.
Why EXPLAIN may be unavailable
EXPLAIN is an explicit action against the original configured connection. The package supports eligible read queries on MySQL, PostgreSQL, and SQLite; it does not run EXPLAIN ANALYZE.
| Requirement or result | What to check |
|---|---|
| Full, complete bindings are required | Use the full binding policy and capture again if the old bindings were masked, omitted, or truncated. |
| Only one read query can be explained | Use an eligible SELECT or read-only WITH query. Mutating, multi-statement, and locking queries are rejected. |
| The connection is unavailable | Restore the same configured connection and repeat the action. |
| SQLite cannot find a table or function | Check the database schema and connection-specific function registration. |
| Unsupported database driver | Use your database client to inspect the plan. |
MySQL uses EXPLAIN, PostgreSQL uses EXPLAIN (FORMAT JSON), and SQLite uses EXPLAIN QUERY PLAN. Their output fields differ. Treat a plan as a lead to confirm against the real schema and data.
Read transaction boundaries with the query sequence
Begin, commit, and rollback markers help place SQL within a transaction on a particular connection. A rollback can explain why a captured write did not become a lasting database change. Check the actual database result as well as the marker.
For a repeatable fix, continue with Testing or the agent walkthrough.
Next step
Look beyond SQL
Use the timeline, request duration, HTTP calls, rendering, and memory when database time does not explain the page.
Open the performance guide