Debugging workflows
Find where the request spent its time
Use the overview to choose a direction, then follow ordered work, queries, HTTP calls, rendering, models, and events to the code you can change.
Measure a stable request
Local timings move with cold caches, debugger overhead, machine load, and the amount of data on the page. Make comparisons useful before drawing a conclusion.
- Compare the same method, path, request type, and realistic data.
- Use a second warm request when startup, compilation, or cache warming affects the first one.
- Repeat the request more than once when the difference is small.
- Use production monitoring for production latency; use The New Debug Bar to explain local work.
The same workflow applies to API endpoints. Send requests with an HTTP client and compare their exact profiles through MCP without a browser. Keep the payload, authentication, and cache state consistent. For APIs called by a page, select each later request in the bar instead of attributing its work to the initial page load.
Use the overview to choose a direction
| Signal | Useful next inspector |
|---|---|
| Query time explains much of the request | Queries and Models |
| Total duration is high but query time is low | Timeline, HTTP client, Views, and Events |
| Peak memory is unexpectedly high | Models, Views, returned data, and large captured operations |
| One Livewire update is slow | Livewire, Timeline, Queries, and Views for that update profile |
Read work in execution order
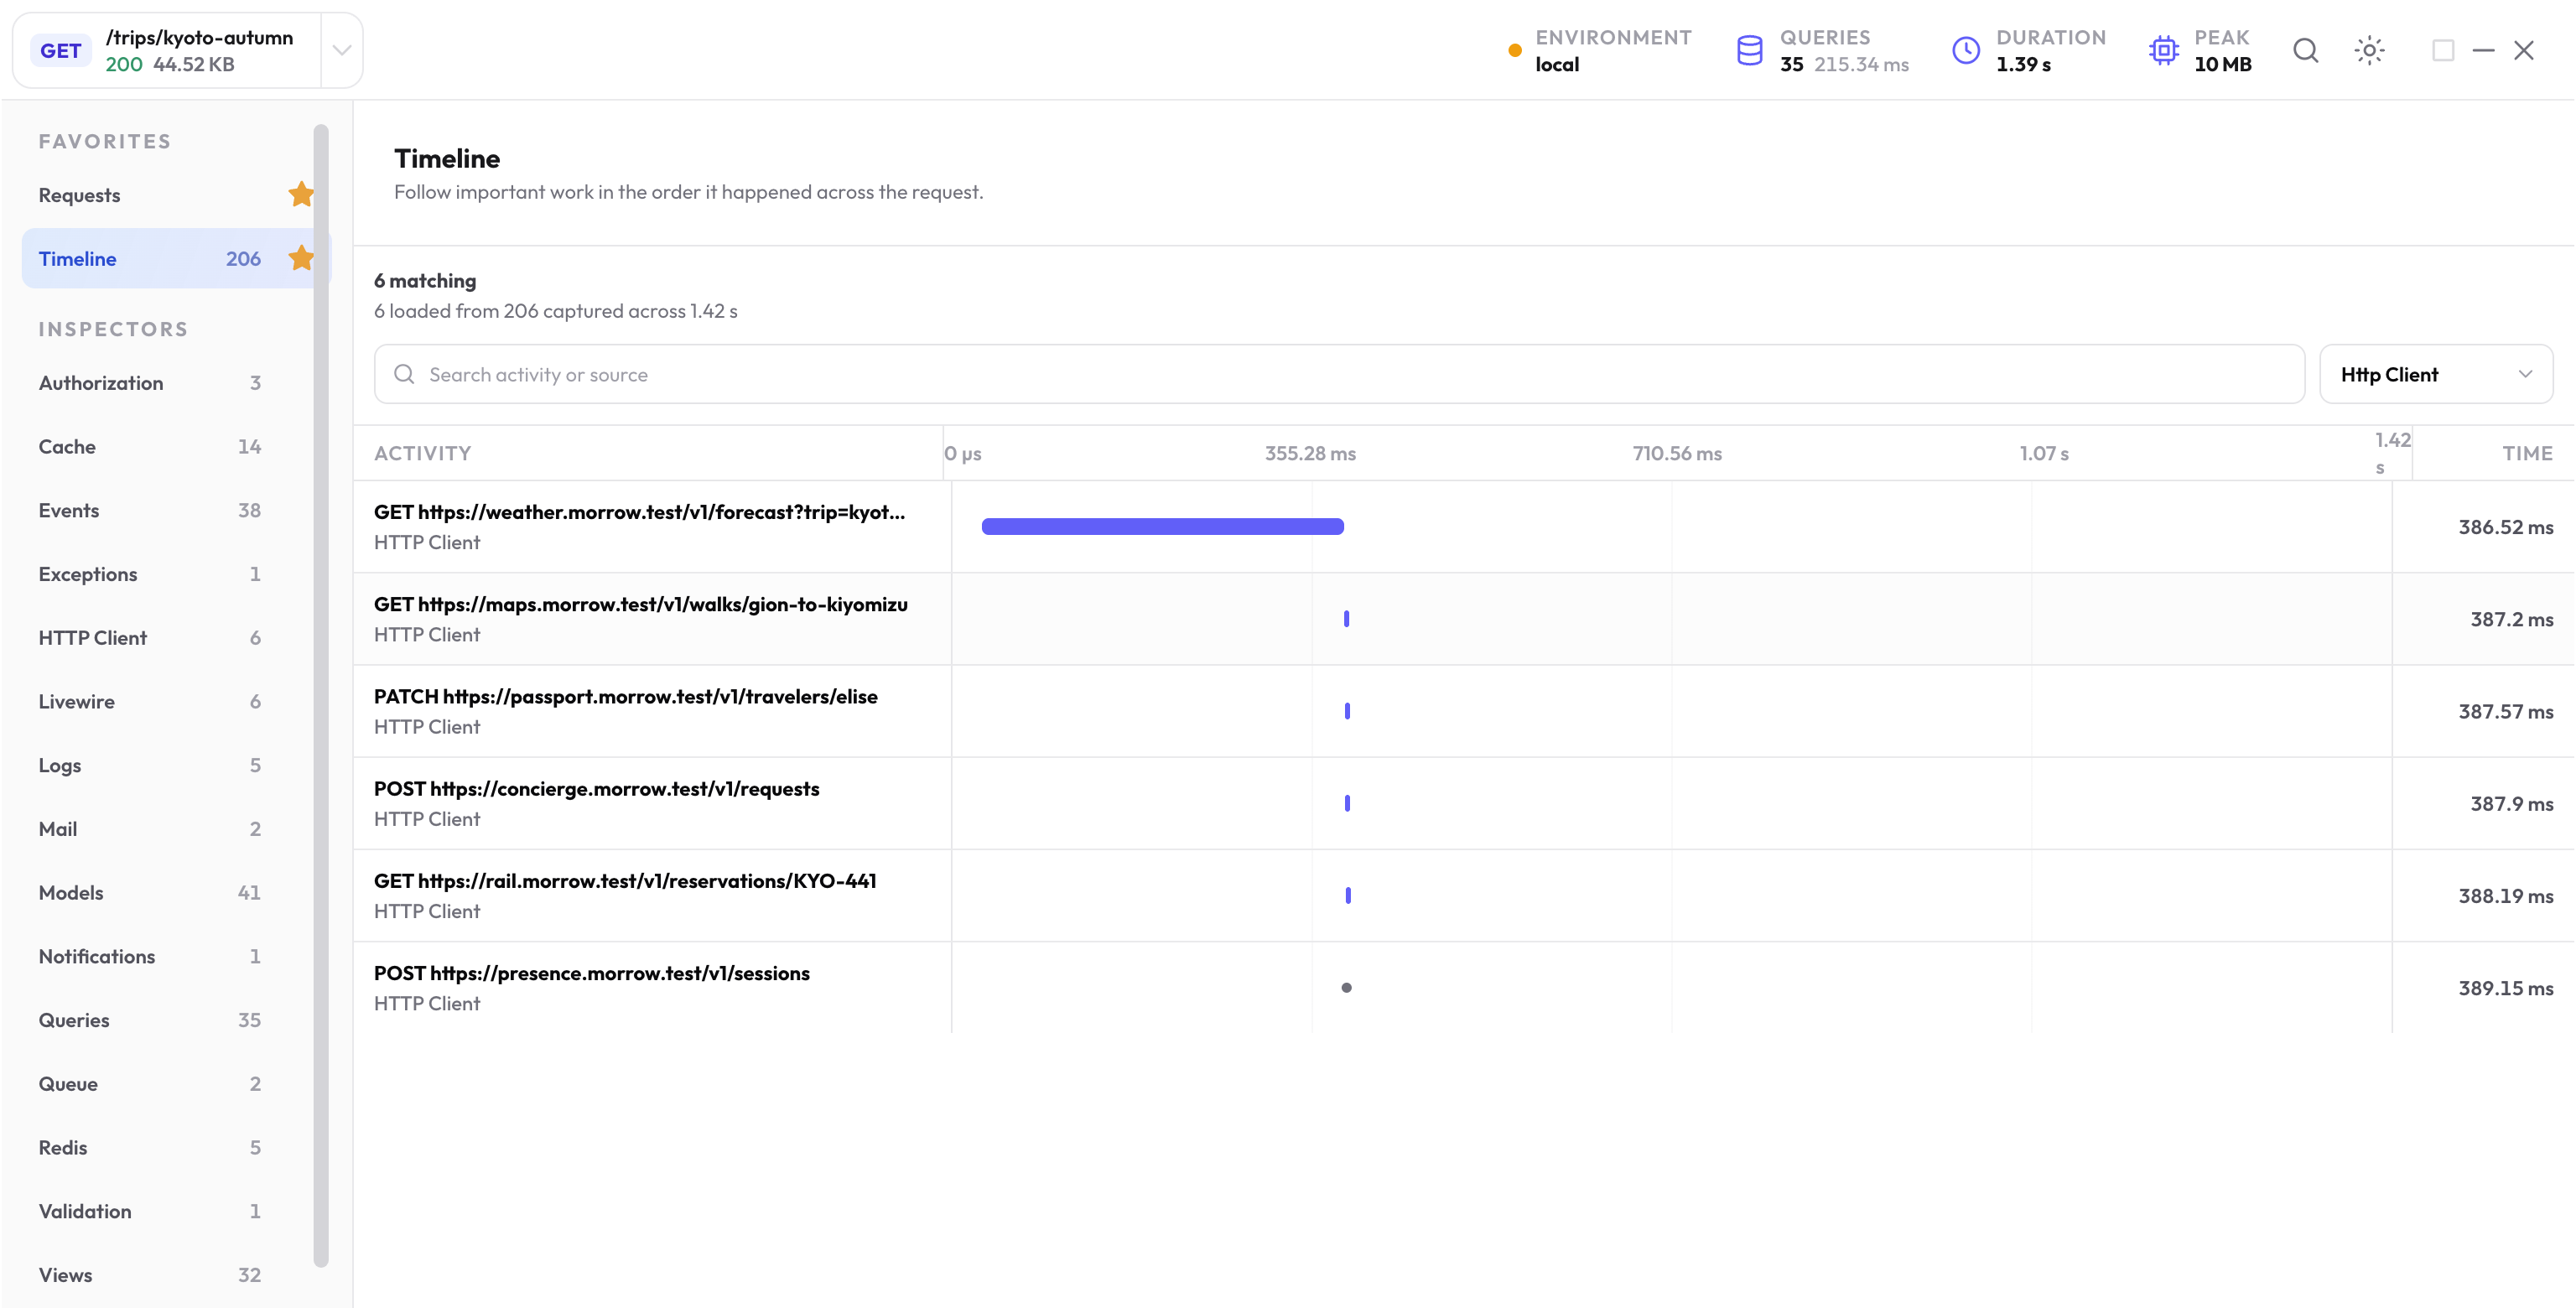
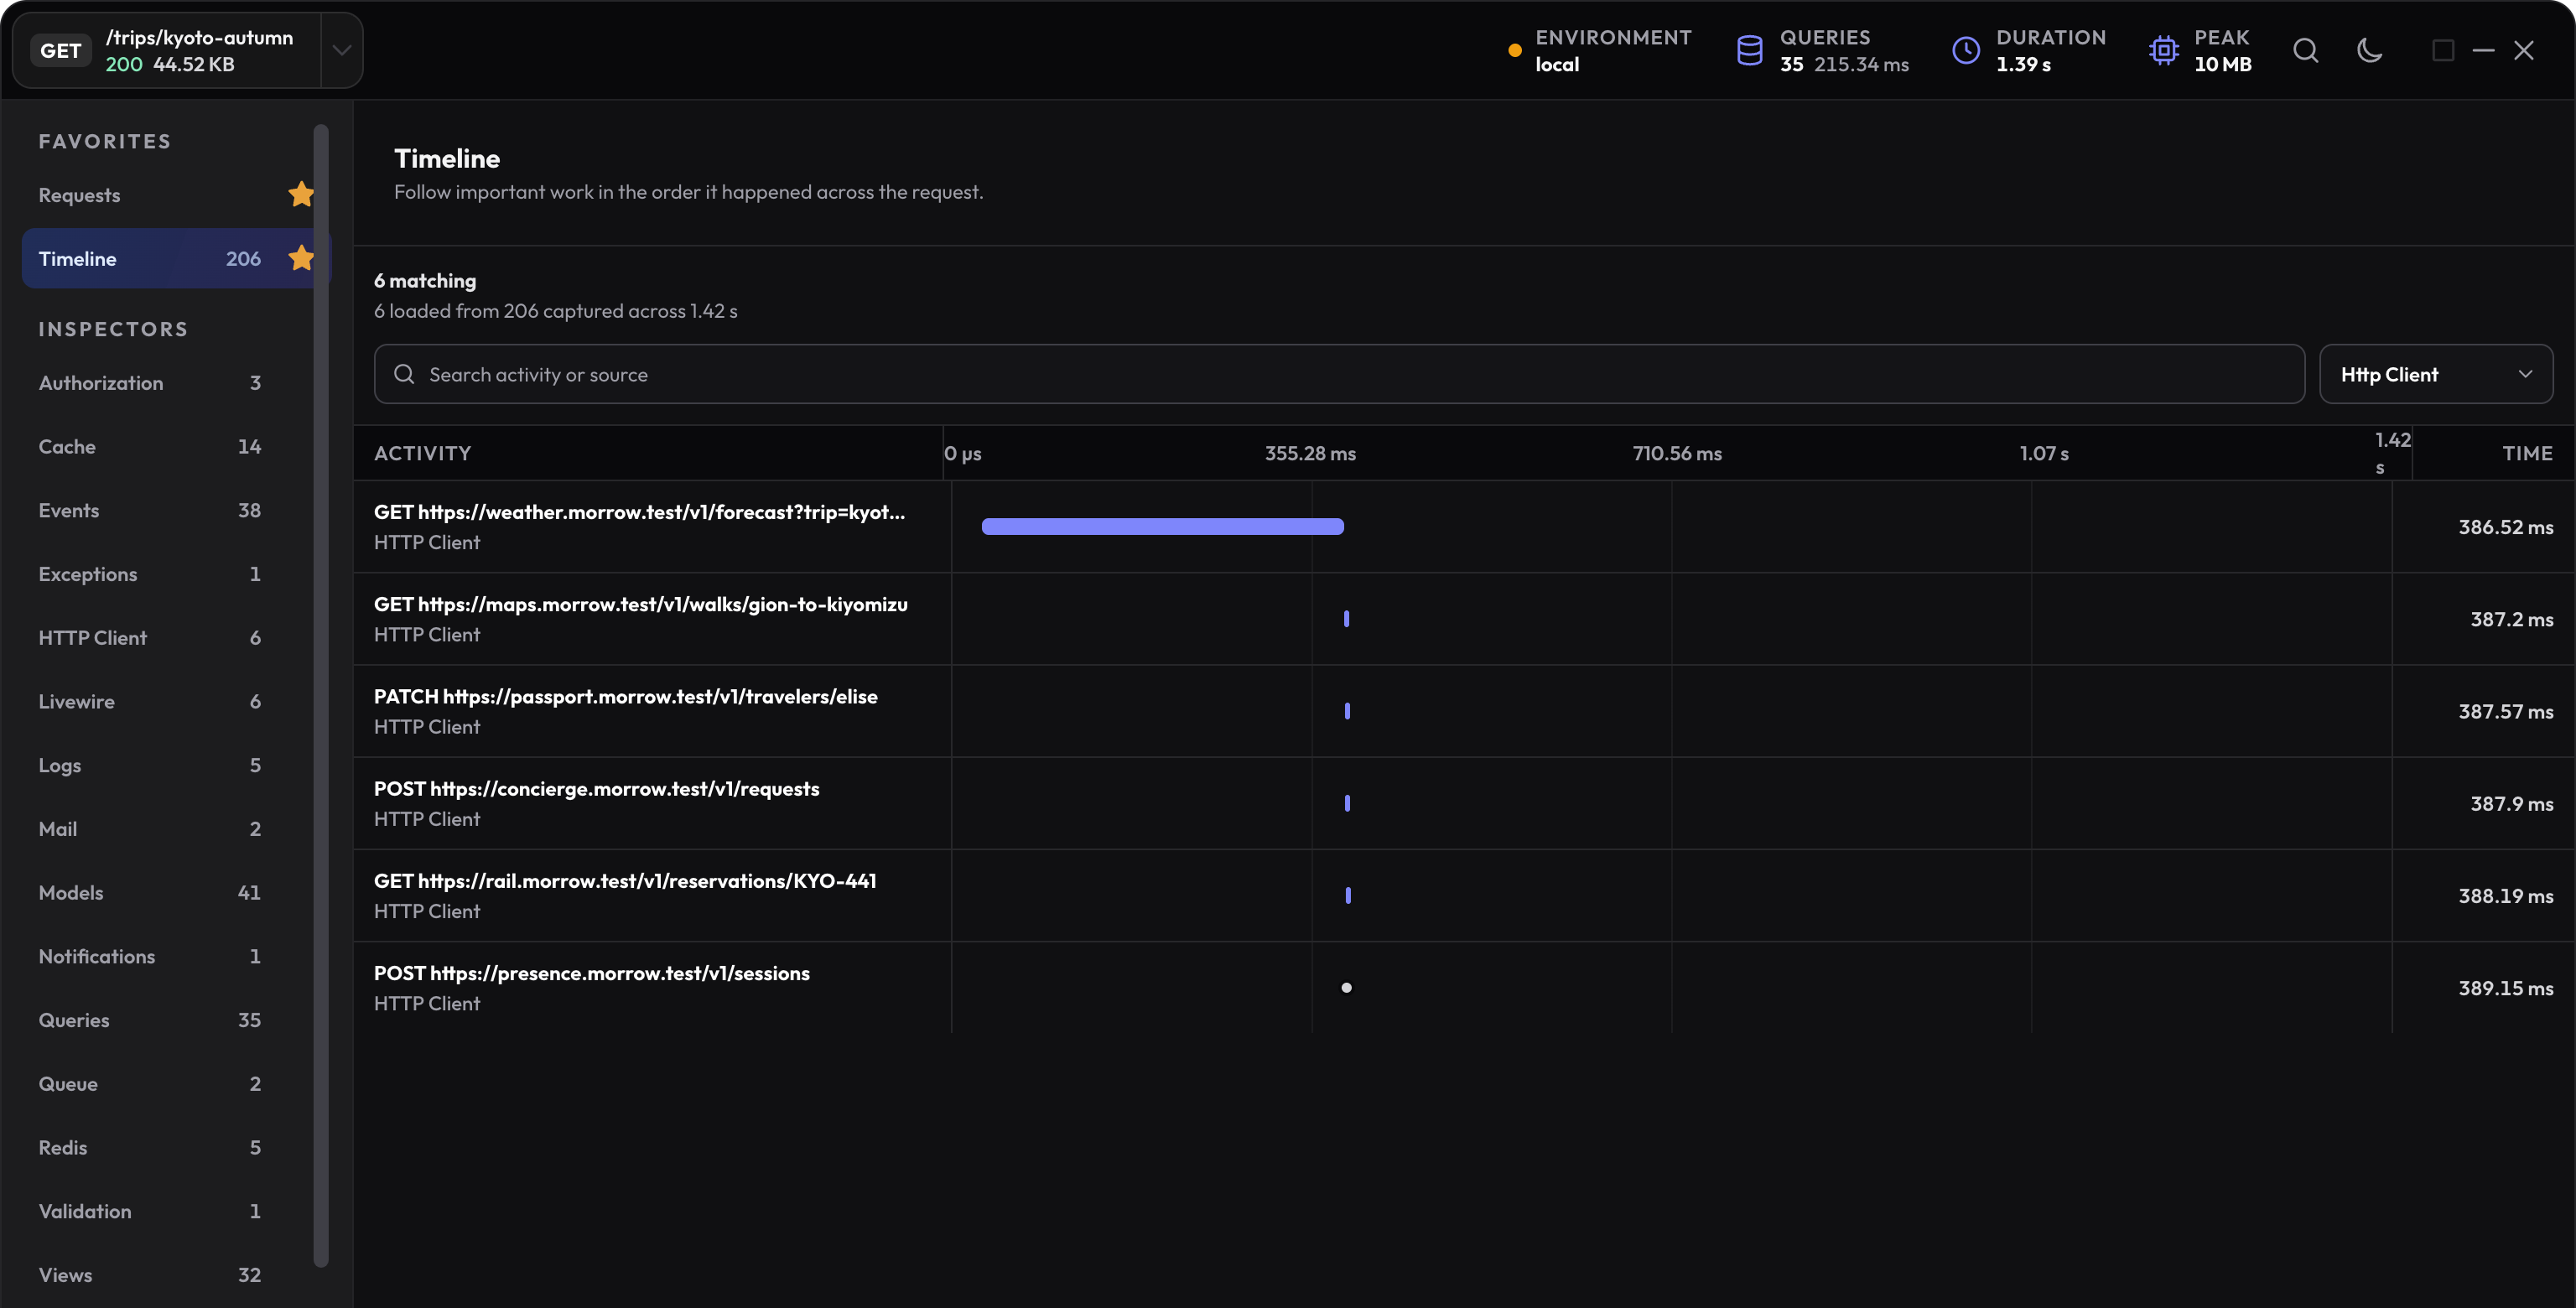
The Timeline joins supported activity into one ordered view. Use it to see whether expensive work is isolated, repeated, or waiting on another operation.
Open a timeline item for its source and related detail. A long outbound request, a sequence of repeated queries, repeated view rendering, or a burst of model work gives you a concrete inspector to inspect next.
Follow the bottleneck to its cause
-
Open the dominant operation
Choose the largest credible source of time or memory, not merely the inspector with the most rows. -
Inspect its application source
Use the file, line, and retained application stack to find the caller that controls the work. -
Check related evidence
Connect a model retrieval to its queries, an HTTP call to its response, or a repeated view to the data and loop that rendered it. -
Change one cause
Reduce duplicate work, request less data, batch a remote call, cache a stable result, or move work only when the evidence supports it.
Verify the improvement
Repeat the same warm request and compare the metric your change was meant to improve. Also check status, response behavior, query count, and findings so a faster result did not hide missing work.
For a path with a stable budget, use The New Debug Bar’s profile assertions to protect maximum duration, query count, query time, peak memory, and error-free behavior in a Laravel test.
Example: the page is slow, but SQL is fast
In a local example route, a controlled HTTP response can make remote waiting easy to recognize. This uses a fake so no partner service receives the request:
use Illuminate\Support\Facades\Http;

Http::fake([
    'partner.example.test/*' => function () {
        usleep(300_000);

        return Http::response(['available' => true]);
    },
]);

$availability = Http::get('https://partner.example.test/availability')->json();
Capture that route and open HTTP Client and Timeline. A roughly 300 ms outbound operation explains time that a query-only inspection would miss. The exact local duration will vary.
For a real application, follow the caller before choosing a change. Remove an unnecessary call, reuse a result, batch work, or cache it only when that preserves the remote data contract.
Repeat the same request after the change and check returned data, call count, failures, and duration. Do not call a missing result a performance win.
Know what the measurements mean
- Timed operations have durations; point events show when something was observed.
- Related measurements may overlap. Adding every row does not produce exclusive request time.
- Views records composition activity, not per-template Blade render duration.
- Peak memory is a process peak, which needs context in a long-lived runtime.
- The Timeline is not a CPU flame graph or production latency monitor.
Use the HTTP client guide for response failures and retries, and Eloquent when repeated model work is the stronger lead.
Next step
Protect a performance budget
Read a profile from the response header and assert the limits that matter for an important Laravel path.
Open the testing guide