Debugging workflows
Follow failures and log context back to code
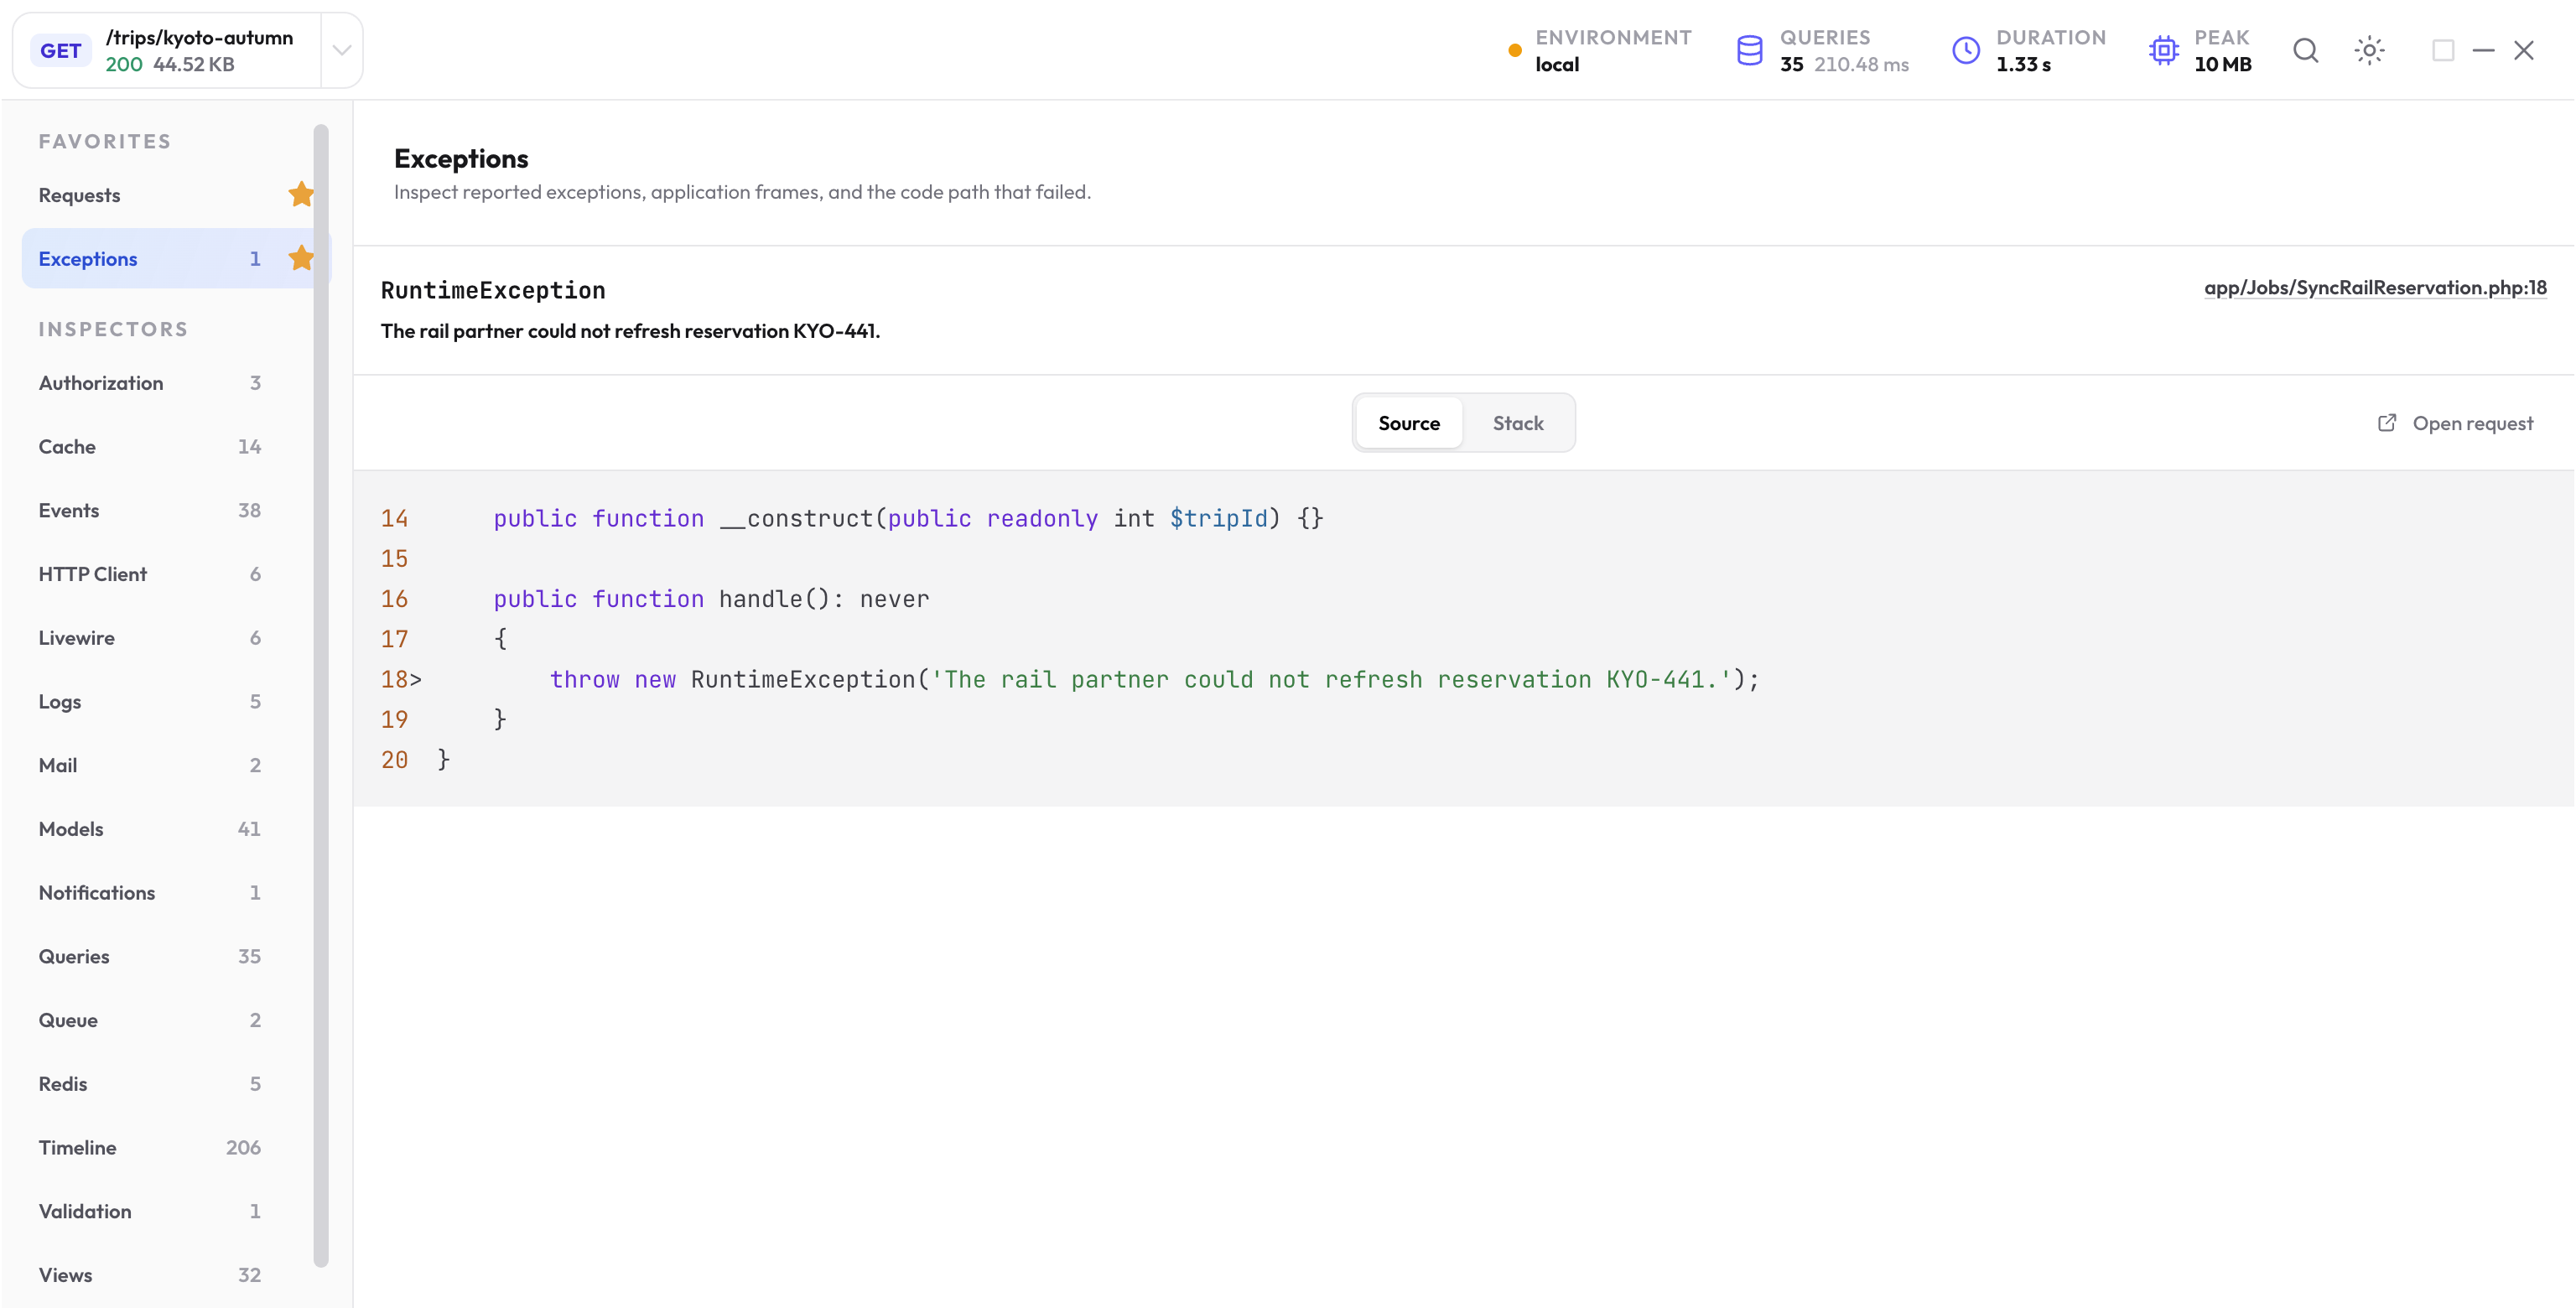
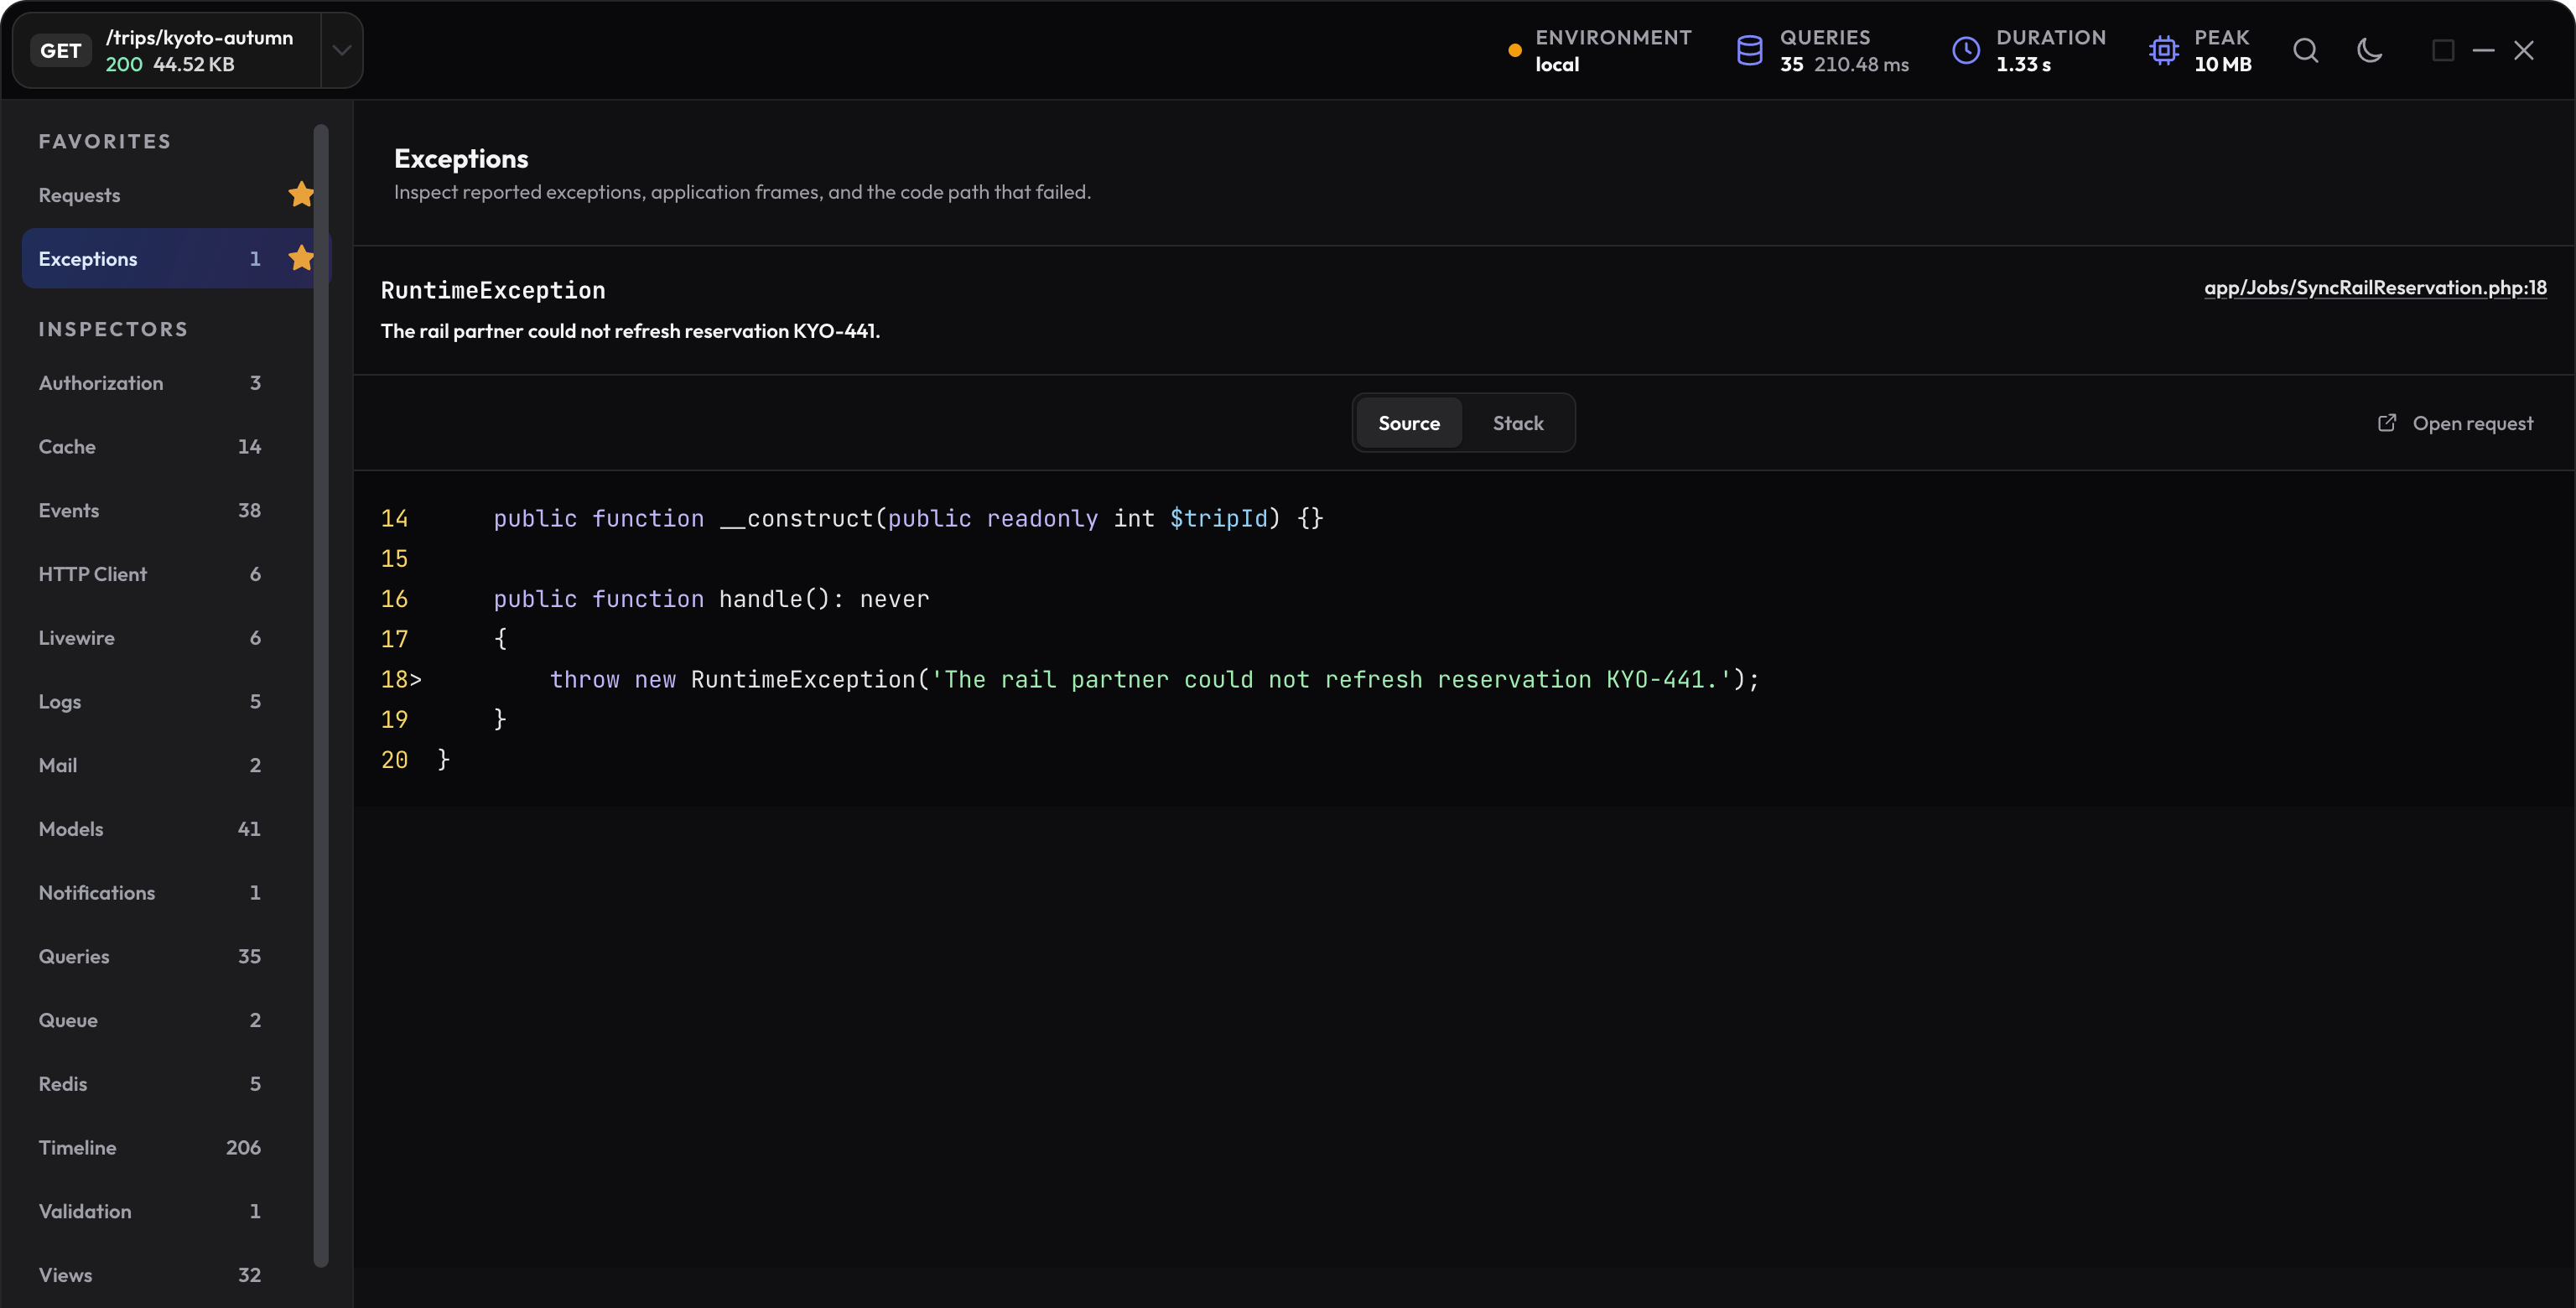
Use the request status and findings to find the relevant exception, then inspect application frames, retained causes, source context, and nearby log entries.
Start with the selected request
Confirm the method, path, request type, and time. A failed background request can appear after a successful page response, and an exception may be reported even when application code catches it and returns a normal status.
Open the exception summary
Use the exception class, message, occurrence count, and first application location to choose the failure that matches the symptom. Repeated reports of the same logical exception stay grouped so one cause does not dominate the view.
Open the detail for its application path and source context. Framework frames remain available for deeper tracing, but begin where your application first enters the failing path.
Read retained causes and frames
Wrapped exceptions can preserve a chain of causes. Follow the chain until the message and location explain the original failure, then move outward to see how application code handled or transformed it.
- Application frames show the code path you control.
- Vendor frames show framework or package behavior when deeper context is needed.
- Source context keeps the failing line with nearby code within the configured limit.
- Related logs, queries, HTTP calls, and timeline items can explain what happened immediately before the failure.
Use logs as request-scoped context
The Logs inspector keeps level, message, bounded context, channel information, and the application source that wrote each retained entry. Because the entries belong to one profile, you do not need to search a large log file by time alone.
Start with warning and error levels, but keep lower-level entries when they record the state transition or external identifier that explains the failure. Common sensitive keys are redacted during capture.
Use one evidence loop
-
Reproduce one failing action
Capture the exact request and note its profile ID. -
Open the first application failure
Read the message, causes, application frame, and source context. -
Check nearby evidence
Use the timeline and related logs, queries, or HTTP calls to test the likely cause. -
Repeat after the change
Confirm the request behavior and all error findings, not only the original message.
Example: an exception with a successful response
A local route can report a failure, choose a fallback, and still return a successful response:
try {
    throw new RuntimeException('The local partner example is unavailable.');
} catch (RuntimeException $exception) {
    report($exception);

    Log::warning('Using the saved availability result.', [
        'trip_id' => $trip->id,
    ]);
}

return response()->json(['source' => 'saved']);
Use the normal RuntimeException class and Laravel Log facade in an isolated local example. Capture the response, then compare its 200 status with Exceptions and Logs. The response succeeded because the code selected a fallback; the reported failure remains useful evidence.
A caught exception that was never reported or otherwise captured may not appear. Follow the app’s reporting path before treating its absence as a collector failure.
Connect a message to its request and source
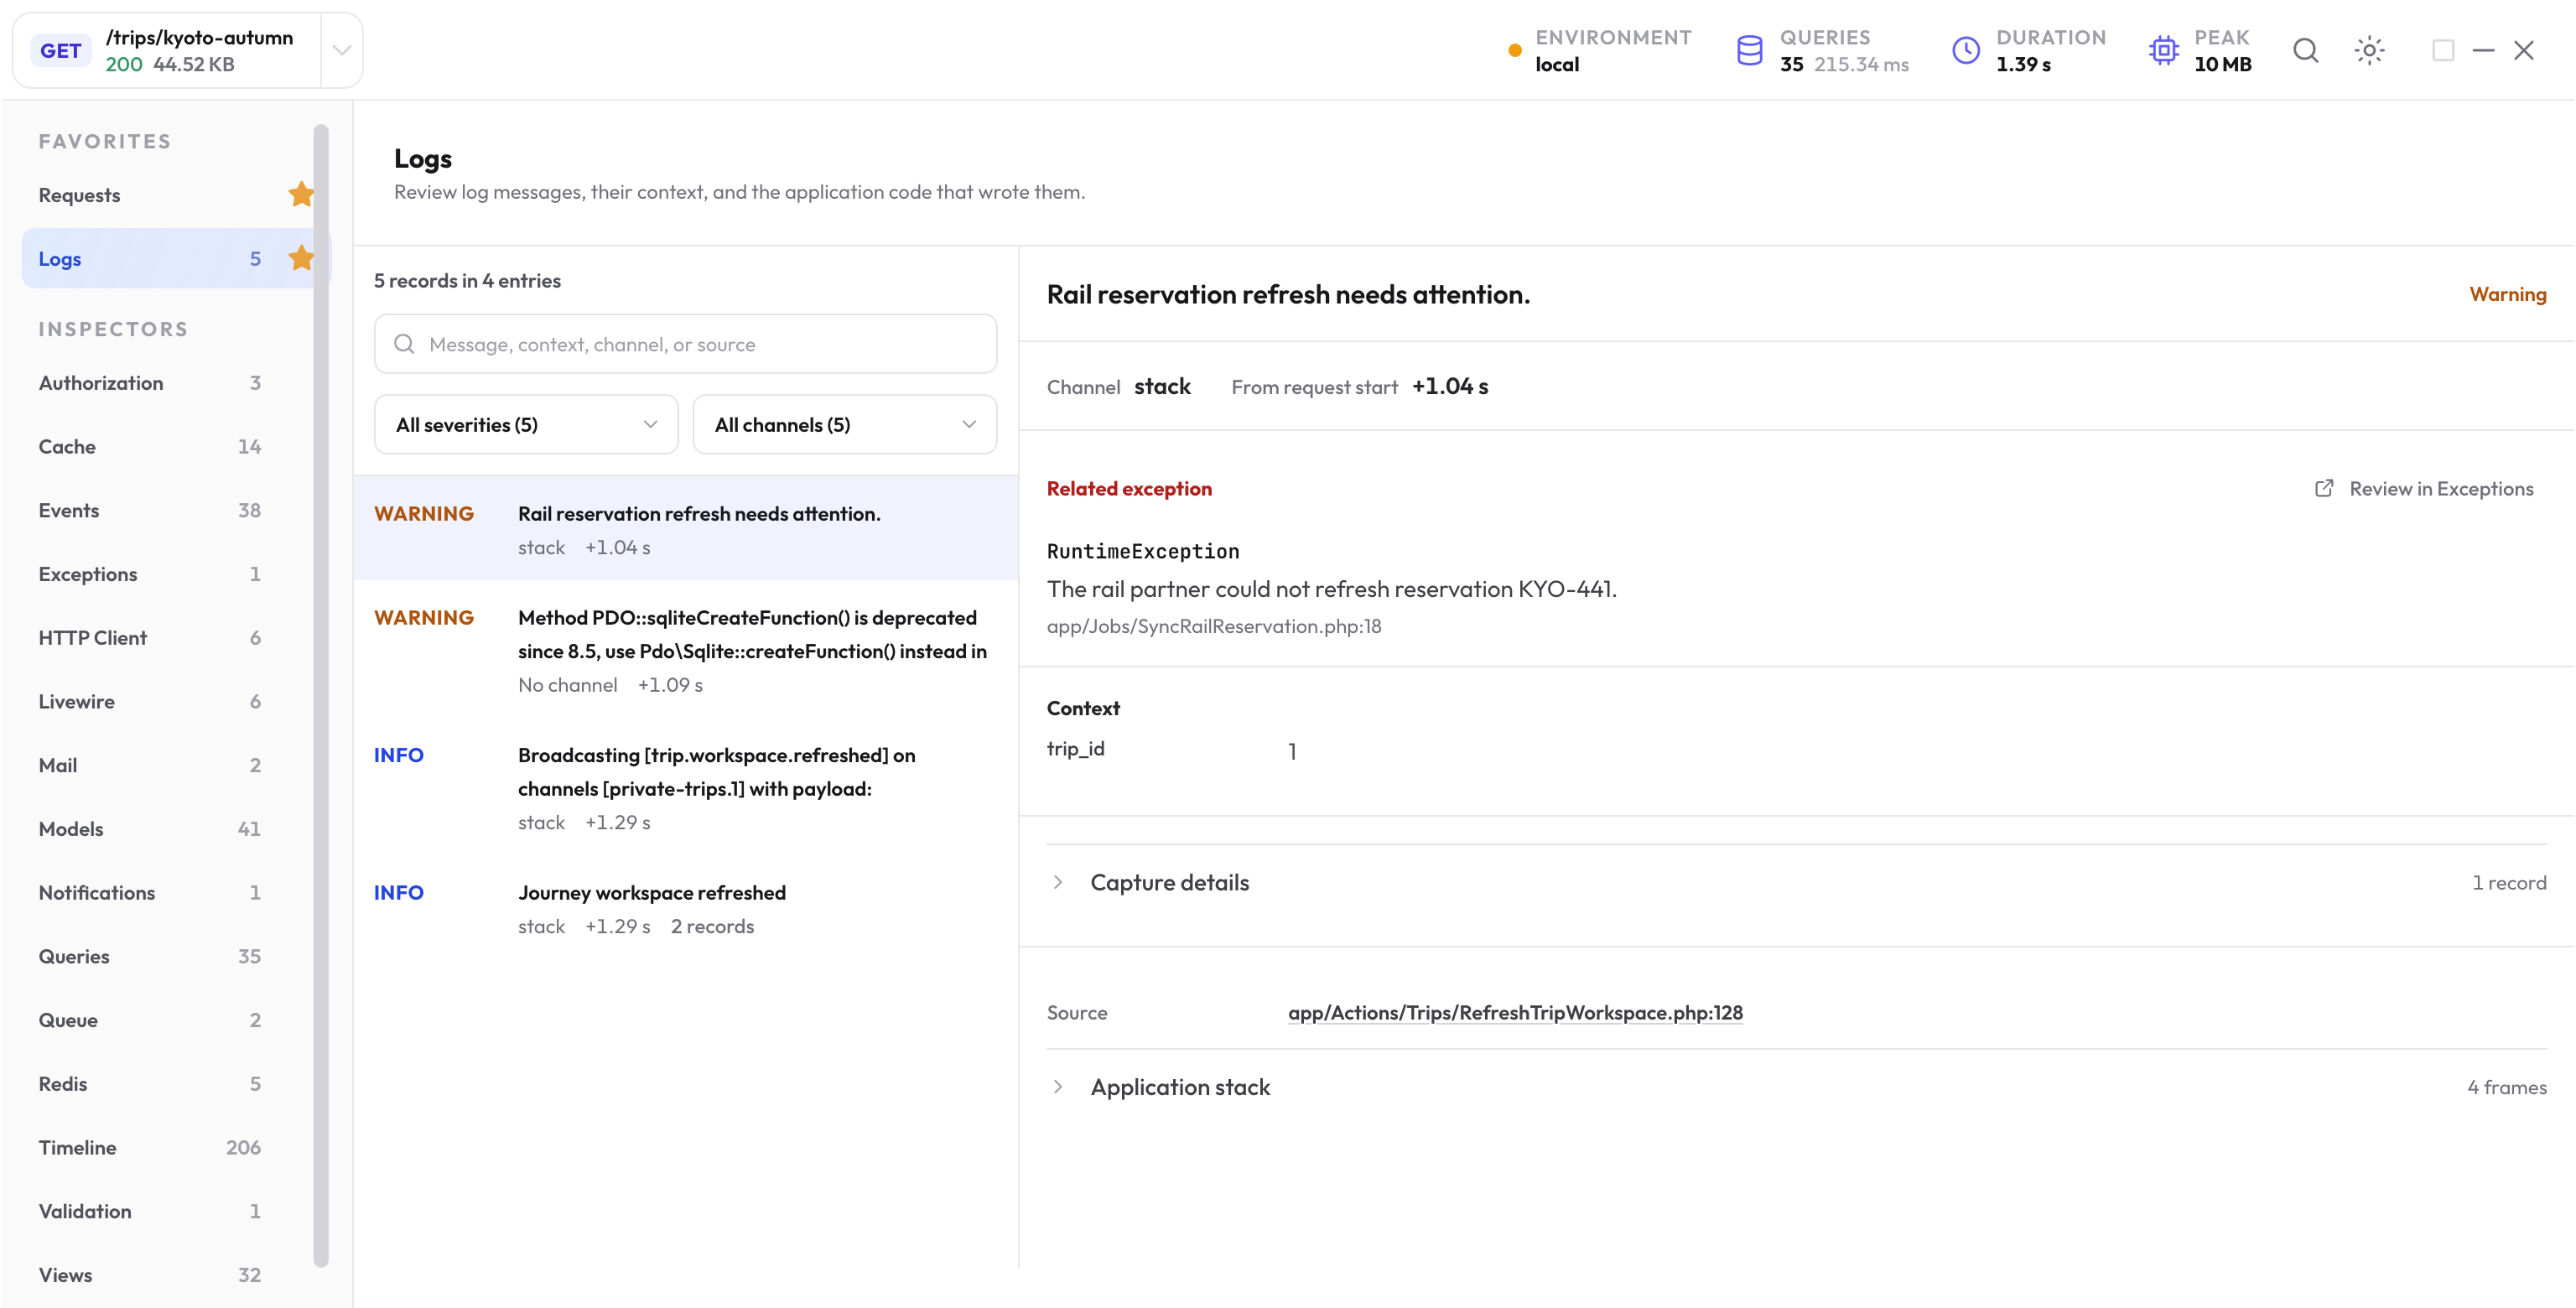
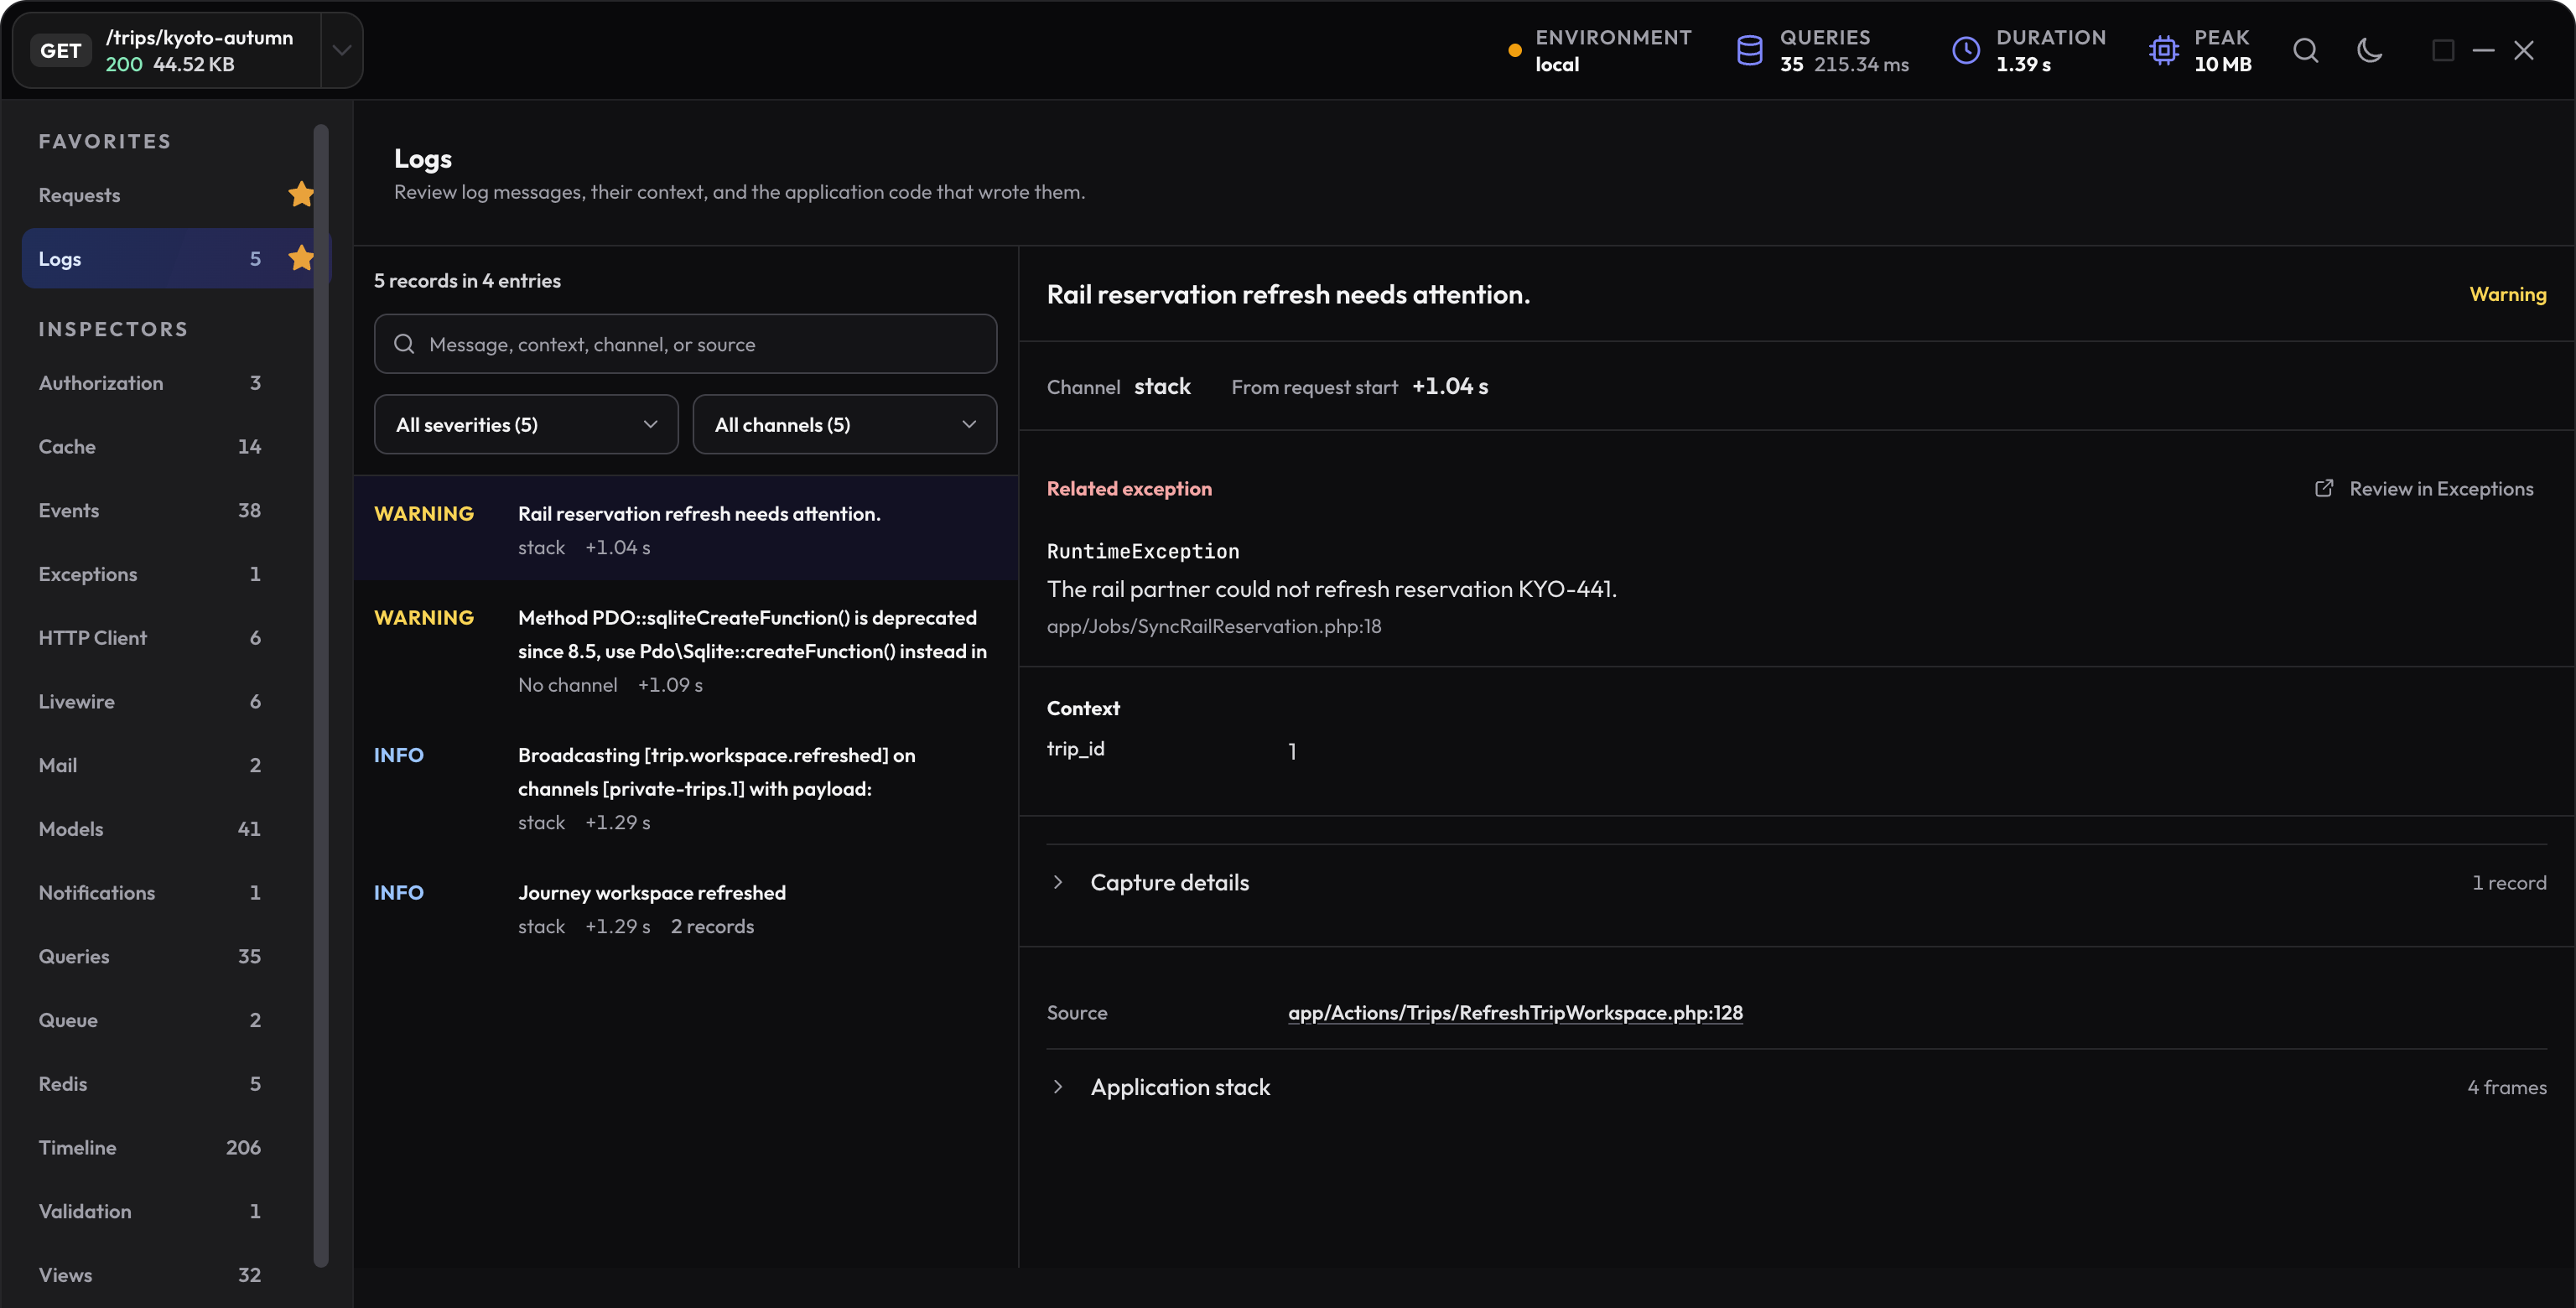
Open the warning’s context and source, then check the nearby exception or HTTP operation. Include concrete, small context when writing your own log message: an operation, a local record ID, or a state transition is more useful than a large object dump.
For wrapped exceptions, follow retained causes toward the original failure. For handled form feedback, use Validation rather than treating every validation message as an application crash.
Verify the failure path and recovery
Check both the recorded error and the behavior the user received. Test the fallback response, then repeat with the dependency available and confirm the successful path. Removing a log message is not a fix for the underlying failure.
Next step
Protect an error-free path
Use a stored response profile in Pest to assert that an important request has no error response or exception finding.
Open the testing guide