Getting started
Start with the right request
Every page load, redirect, fetch, and Livewire update can create its own profile. Select the request you meant to inspect before judging its data.
Choose the request
Open the bar at the bottom of your app. The request picker shows profiles discovered on this page with their method, path, status, type, and recorded time. Match those details to the action you just took.
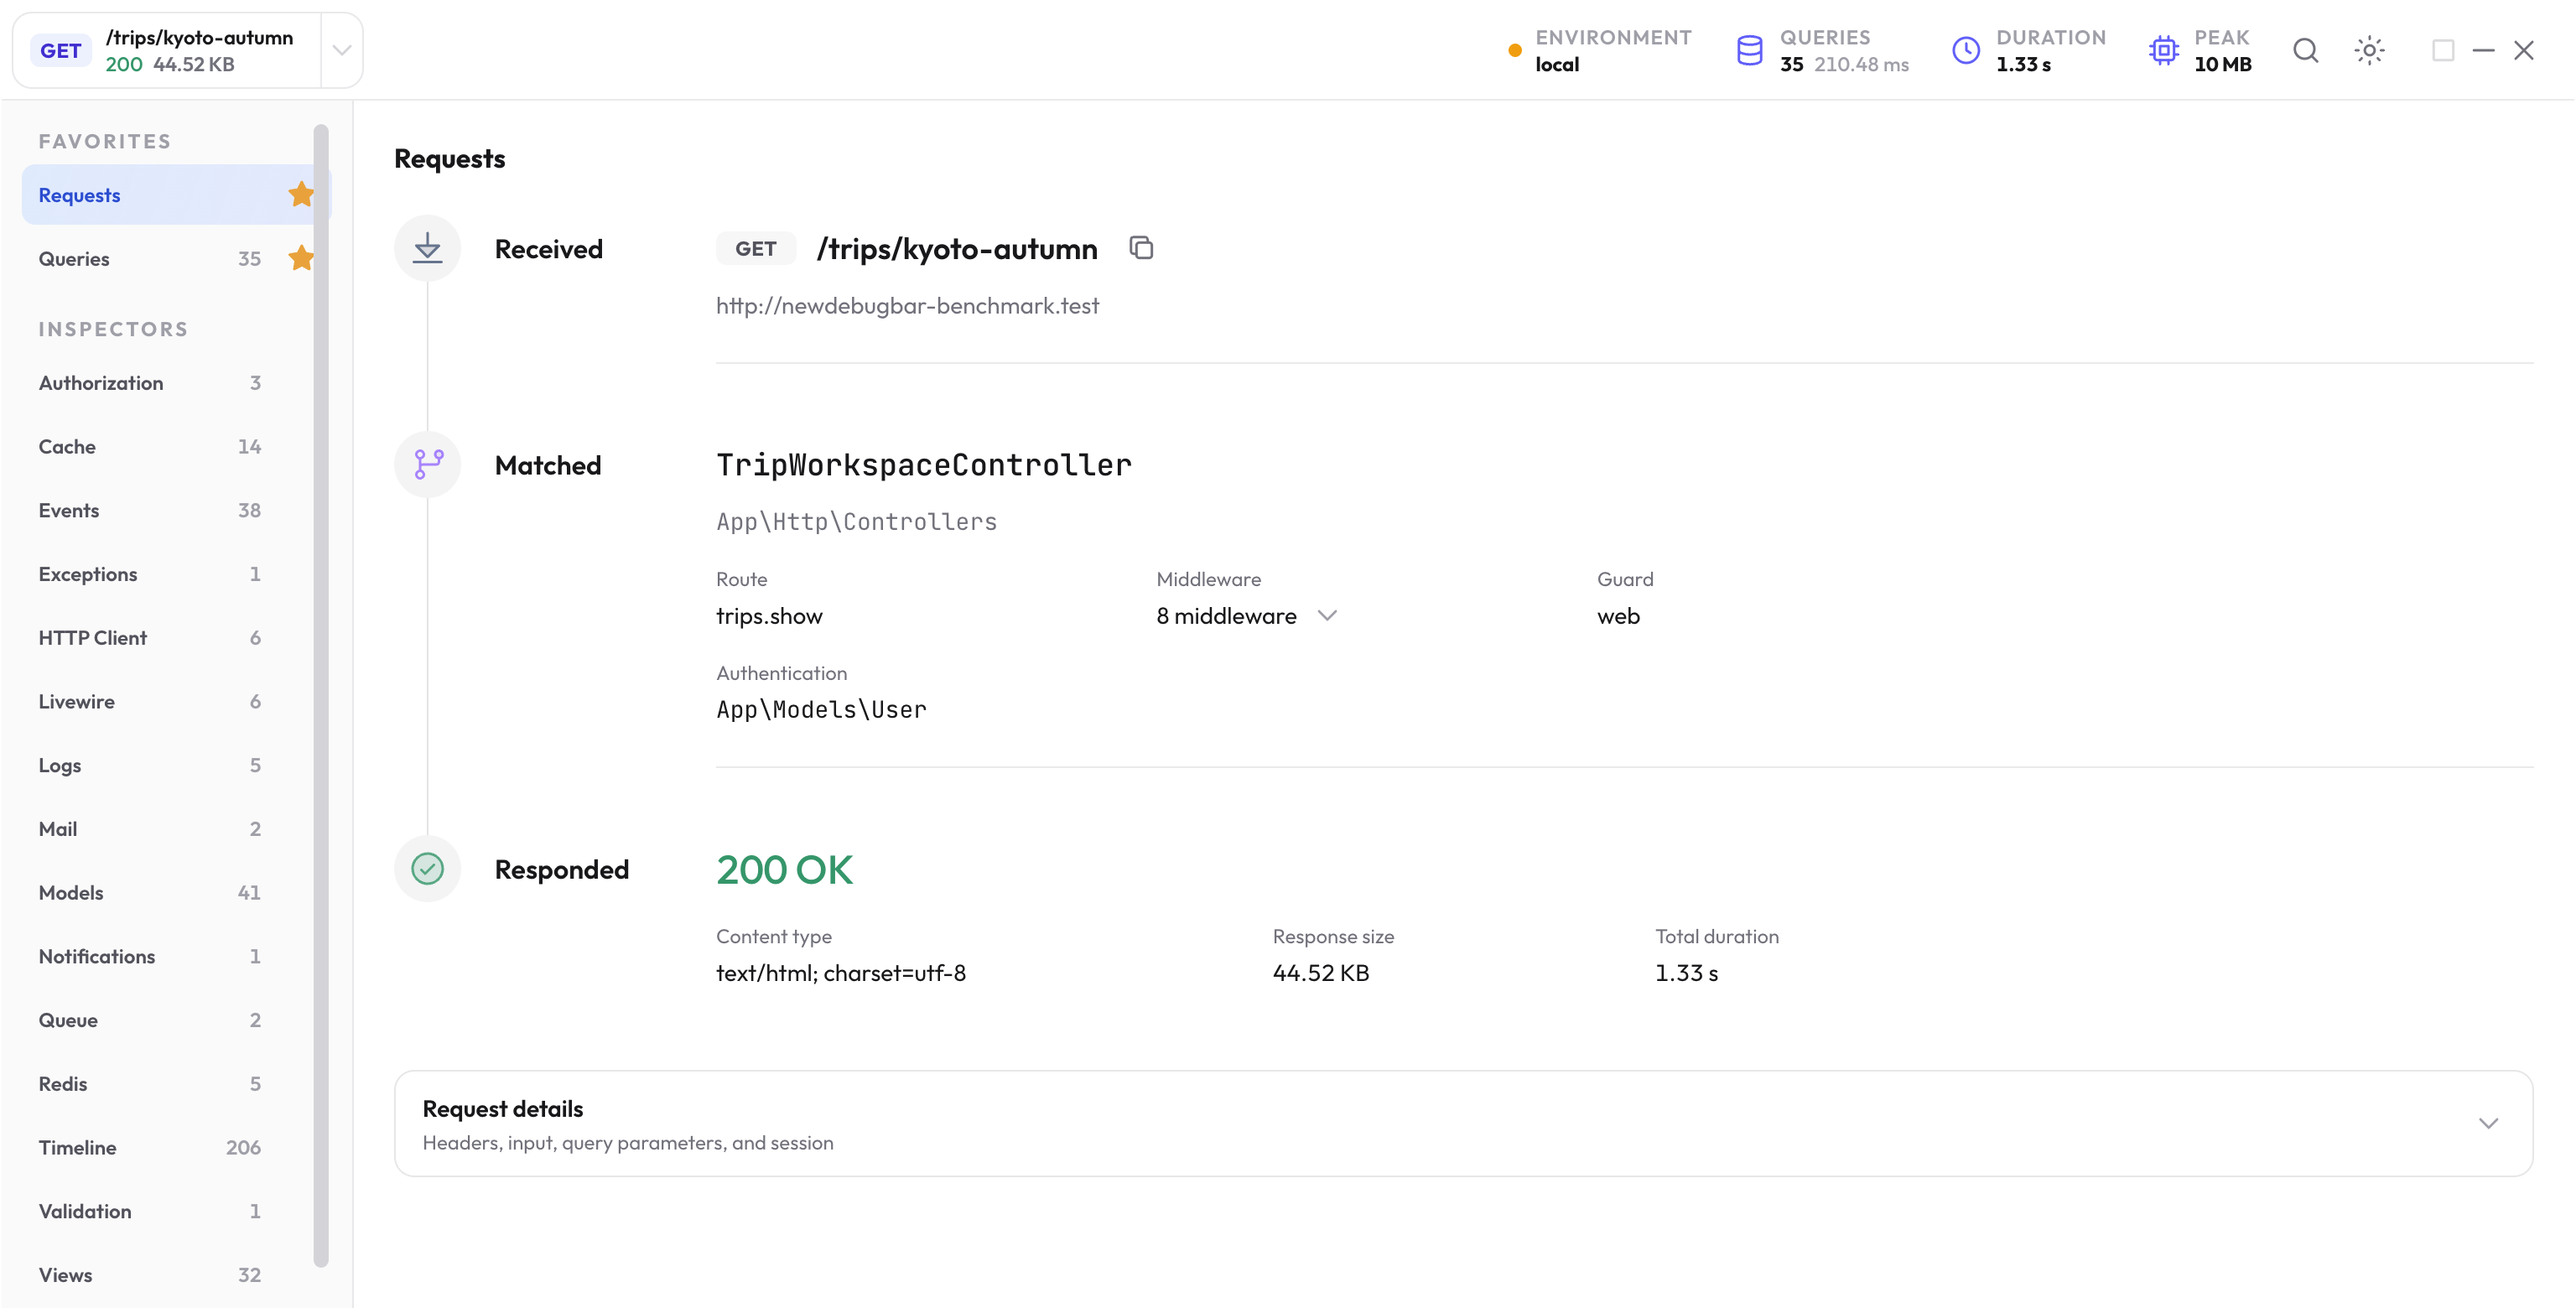
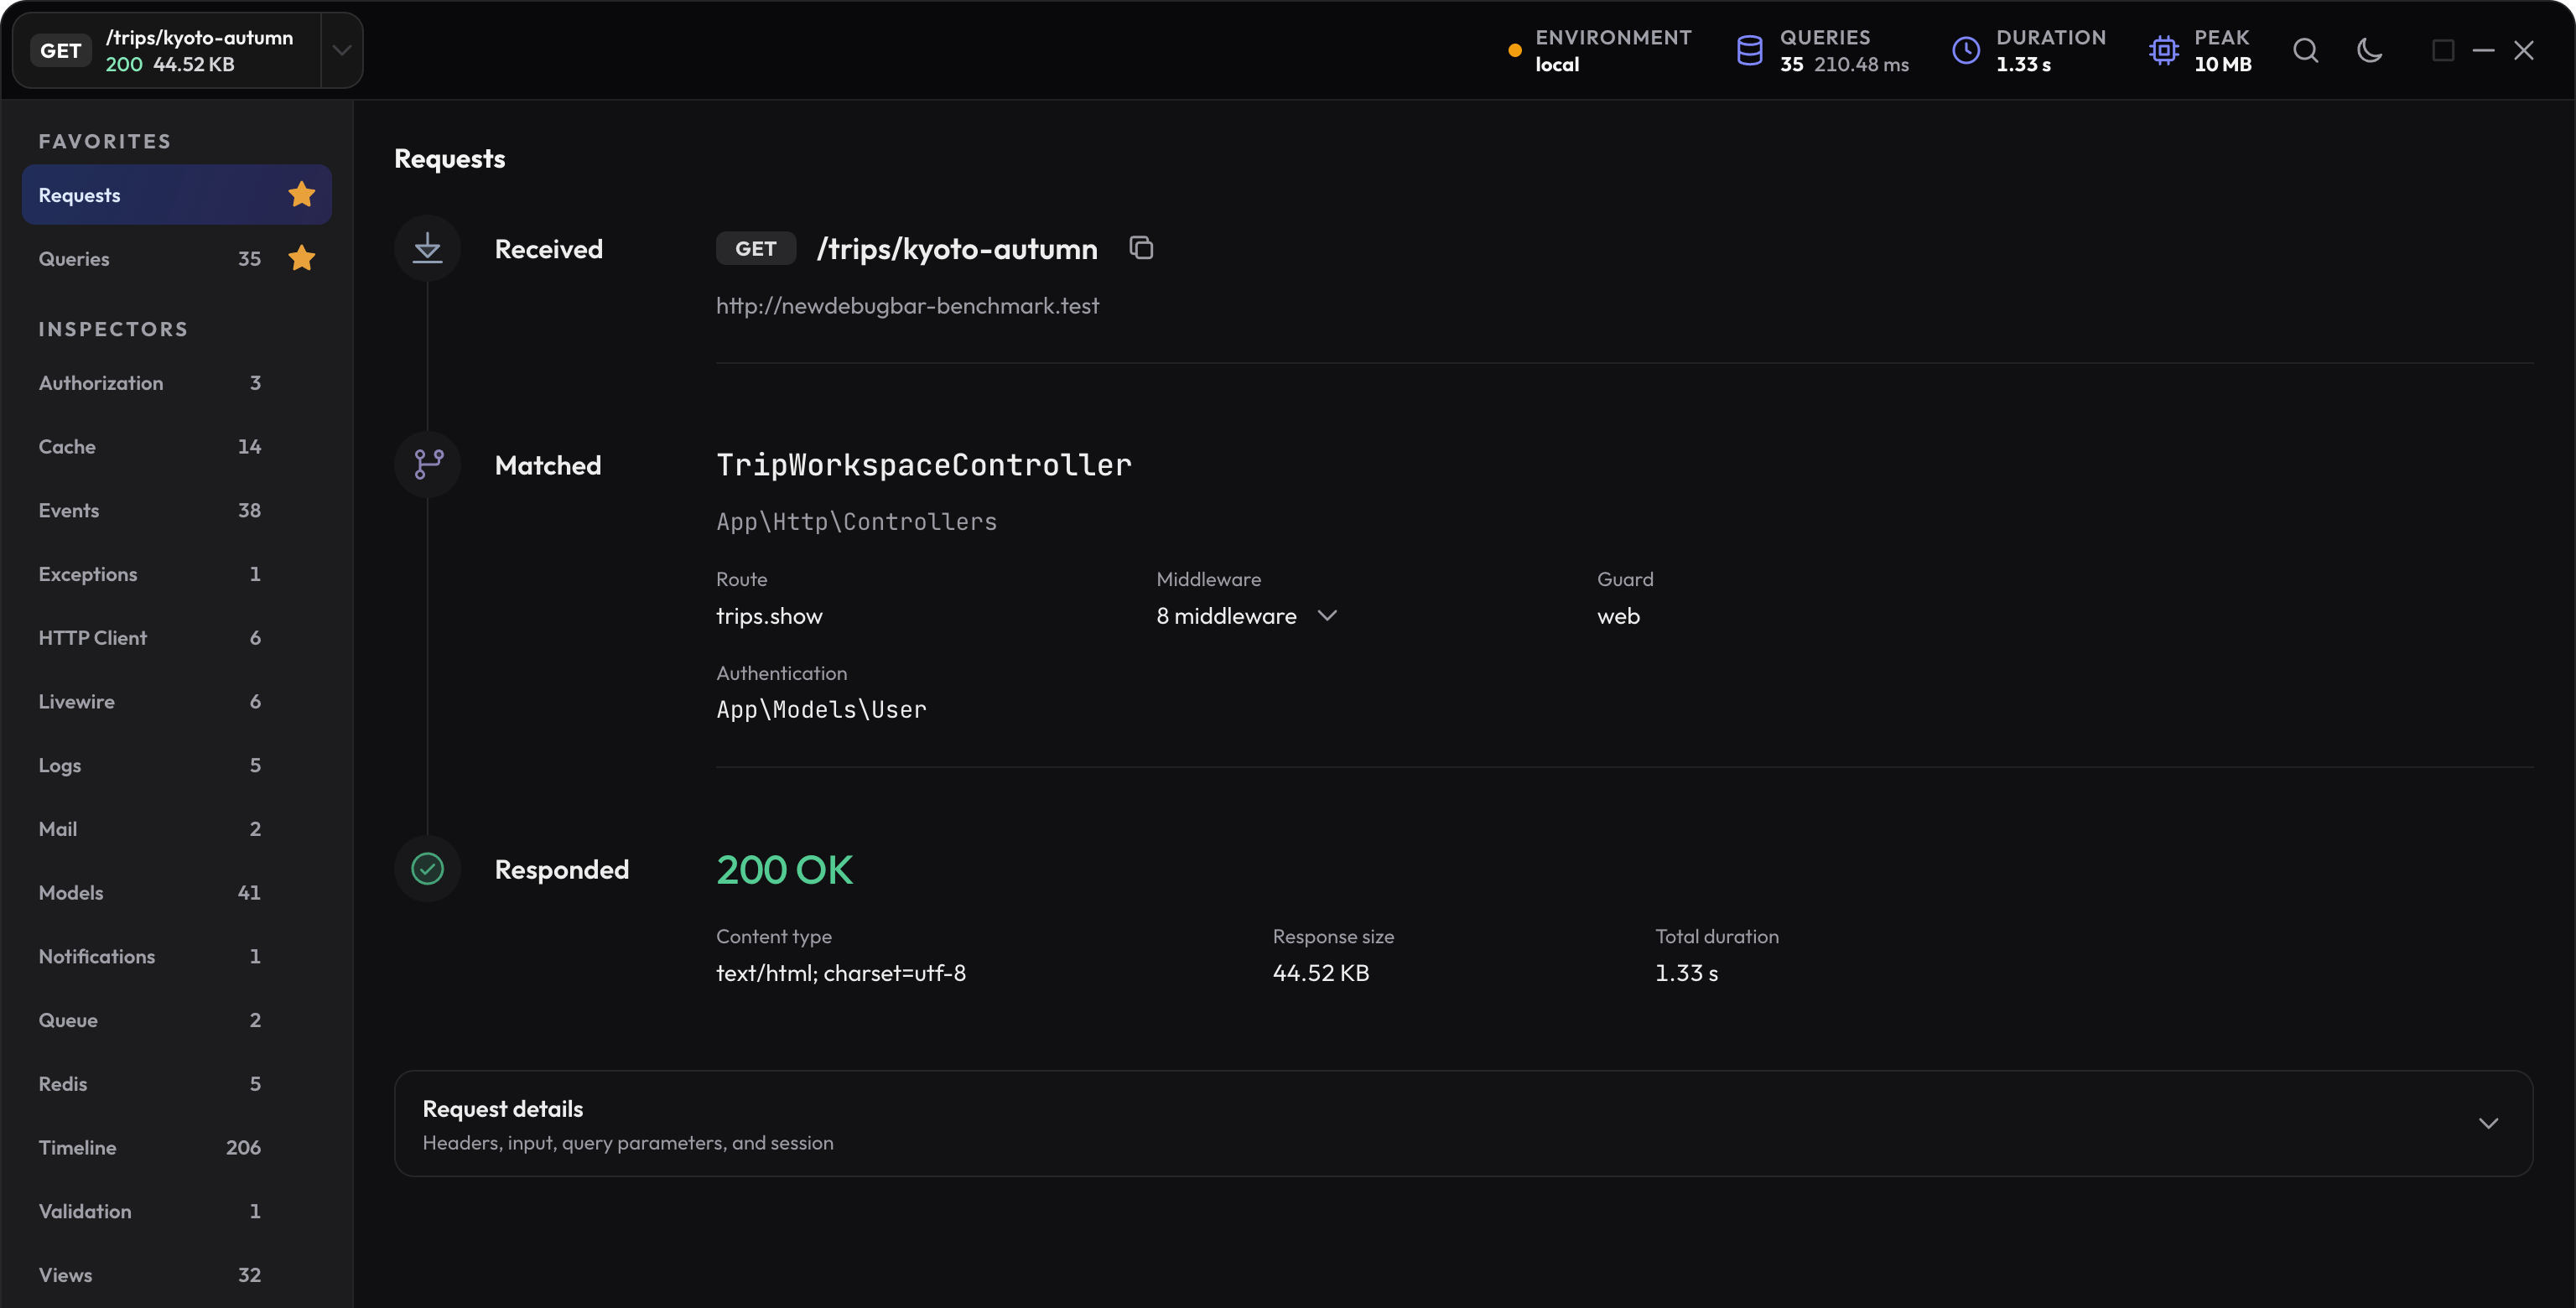
Read the overview first
The compact bar and request overview answer the first questions without making you open every inspector:
- What happened: method, path, request type, status, and duration.
- What needs attention: errors and findings appear before quiet diagnostics.
- Where time went: total query time, query count, and peak memory give you an initial direction.
A high total duration with little database time points away from SQL. A large query count or repeated-query finding points toward the Queries inspector.
Treat findings as leads
Findings turn captured evidence into likely debugging leads: a slow request, repeated query shape, failed HTTP call, high cache miss rate, or another unusual pattern.
Follow the evidence in a small loop
-
State the symptom
Name the visible problem: a failed page, repeated database work, a slow update, or an unexpected side effect. -
Open one relevant inspector
Use the finding or overview to choose Queries, Timeline, Exceptions, HTTP client, Livewire, or another focused inspector. -
Trace it to application code
Use the source location, call stack, related query, model, or event instead of guessing from a count alone. -
Repeat the request
Refresh or repeat the same action after a change. Compare like with like and keep the selected request type the same.
Watch for background requests
When a page calls an internal API through fetch or XMLHttpRequest, The New Debug Bar discovers the profile from that response. Open the subsequent requests menu beside the current request and select the API call. A seat check, quote request, or failed form submission has its own queries, duration, and errors; those belong to the later request, not the original page load.
The newest profile is not always the page you care about. A Livewire update, polling request, asset-related fetch, or application request made after the main response may be newer.
Reselect the profile by method and path after the list refreshes. When an agent or test needs certainty, pass the exact response-header ID instead of saying “the latest request.”
Inspect APIs, redirects, downloads, and streams
A request can be captured without receiving toolbar HTML. JSON, redirects, downloads, and streamed responses preserve their response format. Read the profile header and use MCP when there is no HTML page to host the bar.
No browser is required. Call an endpoint in your enabled local Laravel app with curl, Postman, a test, or another HTTP client. Laravel captures the work, and the MCP server reads the saved profile. It does not send the request itself.
curl -i -H 'Accept: application/json' http://your-app.test/api/trips
Replace that example URL with an existing local route. Read X-NewDebugBar-Profile from the response and pass its value to your agent. For redirects, identify the response whose work you need; the destination page is another request.
See Profile an API without a browser for the agent workflow. Calls made by a separate API client do not automatically appear in an already-open page’s request menu; use their profile IDs through MCP.
| Profile | How to find it |
|---|---|
| A page, later fetch, XHR, or Livewire update discovered on this page | Use the current-page picker and match method, path, type, and time. |
| A separate API client request or an older retained request | Use its exact ID or list retained profiles through MCP. |
| An Artisan command | Use Artisan command profiling. |
| A worker job | Use a correlated worker link or find the retained worker profile through MCP. |
Make the inspector useful for your workflow
- Drag the compact toolbar to the top, bottom, or a corner. The command palette offers the same placement actions.
- Favorite the inspectors you use together and reorder them through the interface.
- Press Command/Ctrl + Shift + P to find a inspector or action.
- On a small screen, use the inspector actions menu to switch inspectors, change theme, or open the command palette.
- Source controls copy an application location. Paste it into your editor or agent when you need the file and line.
If a request or retained value seems absent, follow Find missing profiles and data.
Next step
Trace database work
Learn how to separate slow queries, repeated query shapes, and likely N+1 behavior from normal database activity.
Open the query guide